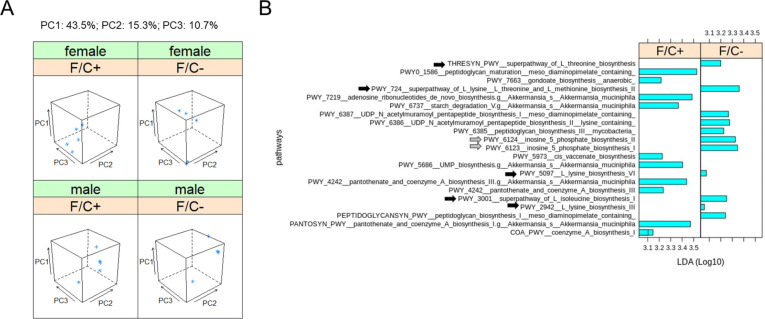
FIGURE 5. Metagenomic profiling of the gut microbiome of mice placed on dietary folate restriction late in life.
(A) Beta diversity principal component analysis plots were based on Bray-Curtis dissimilarity indices (Knight et al., 2018), of the DNA from the fecal microbiome sampled and sequenced at 90 weeks of age, from 5 mice in each test group. Three principal components (PC1,2,3; shown at the top) accounted for ~70% of the dataset variance. (B) Metabolic pathway biomarker changes associated with folate limitation late in life, from metagenomic data of the fecal microbiome. The LEfSe computational pipeline was used to determine the features most likely to explain the observed differences. The computed linear discriminant analysis (LDA) scores (Log10-transformed) are on the x-axis. LDA scores incorporate effect sizes, ranking the relevance of the identified biomarkers and enabling their visualization (Segata et al., 2011). Gray arrows indicate pathways involved in amino acid synthesis and black arrows indicate pathways involved in IMP synthesis.

