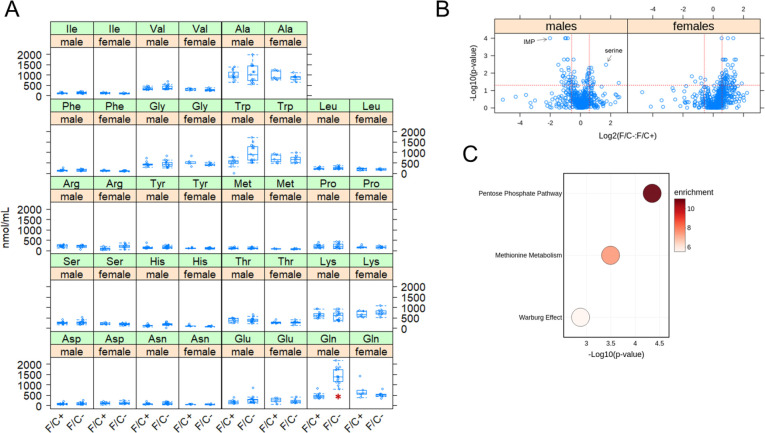
FIGURE 6. Metabolite changes in mice placed on dietary folate restriction late in life.
(A) Steady-state serum amino acid levels were measured at 120 weeks of age using an HPLC-based assay (see Materials and Methods). The measured amounts (in nmol/mL) are on the y-axis. The different diets are on the x-axis for each amino acid, as indicated. The boxplots were drawn as in the previous figures. Differences in glutamine (Gln) levels in male mice were significant (marked with a red asterisk; p=2.6E-05, based on the Wilcoxon rank sum test). (B) Steady-state levels of primary and biogenic amine metabolites from liver tissue collected at 120 weeks of age were measured by GC-TOF MS and HILIC-QTOF MS/MS, respectively. Changes in the indicated pairwise comparisons were identified from the magnitude of the difference (x-axis; Log2-fold change) and statistical significance (y-axis; based on robust bootstrap ANOVA tests), as indicated by the red lines (see Materials and Methods). (C) Metabolite enrichment analysis based on the MetaboAnalyst platform (Chong et al., 2019) for male mice from the data in (B), for metabolites present at significantly lower levels under folate-limitation (p<0.05 and >1.5-fold change). The corresponding metabolic pathways are on the y-axis, and the p values are on the x-axis. The size of each bubble on the chart reflects the relative number of ‘hit’ metabolites in each pathway. The color of each bubble reflects the enrichment ratio, which is the number of hits within a metabolic pathway divided by the expected number of hits. Only pathways with enrichment >2 and FDR values <0.05 are shown.

