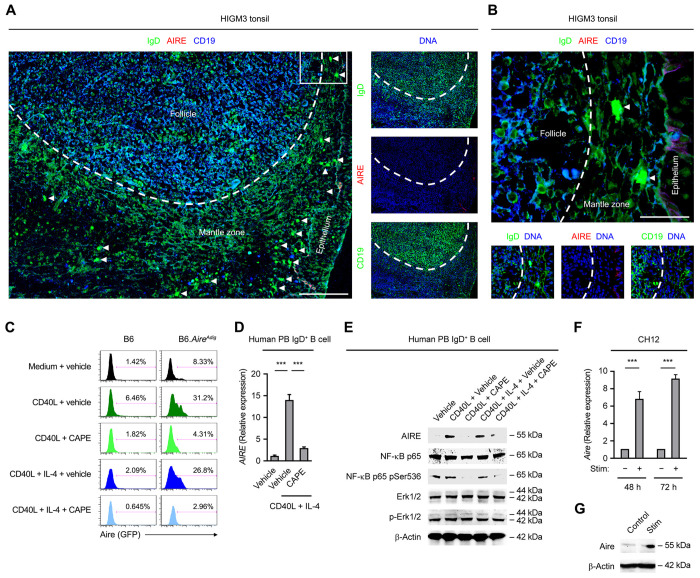
Figure 2. Follicular B Cell AIRE Expression Requires CD40 Signaling.
(A and B) Immunofluorescence analysis of tonsillar tissues of a HIGM3 patient for IgD, AIRE, CD19 and DNA. The area outlined in A is shown with a higher magnification in B. The dotted line outlines the follicles. Bars: 100 μm (A) or 25 μm (B).
(C) Flow cytometric analysis of Aire (GFP) expression in splenic B cells of a B6 or B6.AireAdig mouse treated for 3 d with medium or CD40L with or without IL-4 in the absence (vehicle) or presence of CAPE. The data represent the results from 3 B6 and 3 B6.AireAdig mice.
(D and E) qRT-PCR and Western Blot analyses of AIRE transcript and protein levels, the protein levels of total and Ser536-phosphorylated NF-κB p65, as well as total and Thr202/Tyr204-phosphorylated Erk1/2 in human peripheral blood IgD+ B cells treated with medium or CD40L, or CD40L and IL-4, in the presence of vehicle or CAPE for 3 d. Data are represented as mean ± SEM. ***P < 0.001, by 2-tailed unpaired t-test.
(F and G) qRT-PCR and Western Blot analyses of Aire transcript and Aire protein levels in mouse CH12 cells treated with anti-CD40, TGF-β and 100 ng/ml IL-4 for 3 d. Data are represented as mean ± SEM. P < 0.001, by 2-tailed unpaired t-test.

