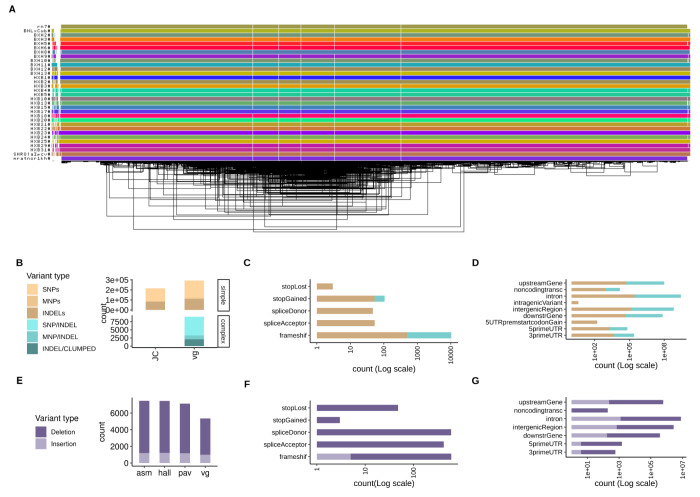
Figure 1. Pangenome graph of chromosome 12 from 31 HXB/BXH rats and genetic variants derived from it.
(A) odgi-viz visualization of the pangenome graph for chromosome 12 from 31 rats. Horizontal colored lines denote haplotypes, with vertical white stripes representing insertions/deletions. Includes the mRatBN7.2 reference genome (top line). (B) Comparison between small variants (<50bp) called from the pangenome graph using vg (vg) with variants joint-called directly from 10x data using GLNnexus (JC), stratified by genome complexity. vg called 36% and 99.95% more simple and complex variants, respectively, compared to JC. (C-D) Predicted functional annotations for small variants called from the pangenome graph. (E) Comparison of three assembly-based methods (asm, hall, pav) and one graph-based method (vg) to call structural variants (SVs, >50bp) (F-G) Predicted functional annotations for SVs called from the pangenome graph.

