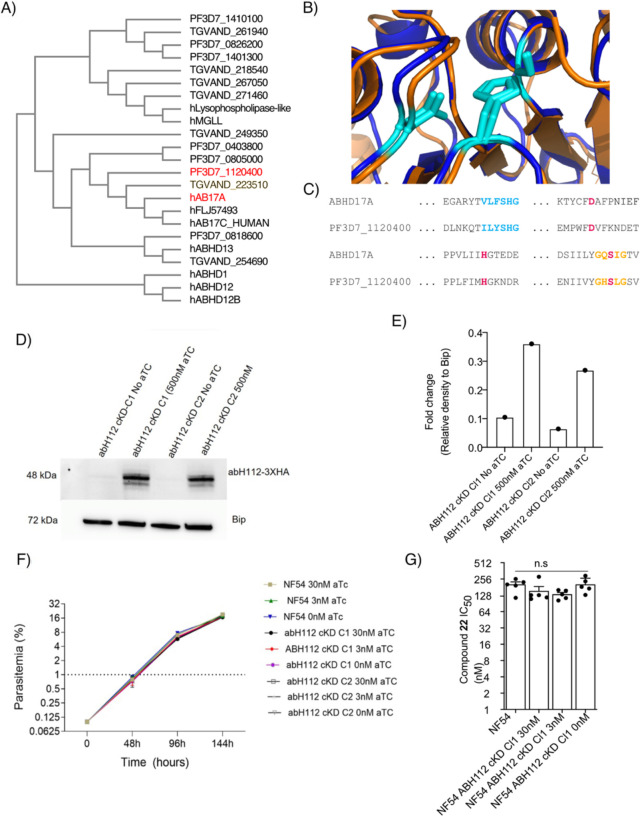
Figure 4: Conditional Catalytic Knockout of abH112 leads to Gene Duplication.
(A) Partial Dendrogram of P. falciparum, Toxoplasma gondii, and human serine hydrolases that share a protein family domain generated using the Clustal Omega algorithm with abH112 and hAB17A colored in red.
(B) Overlay of predicted AlphaFold structure of abH112 (orange) and hAB17A (blue) with active site catalytic triad in cyan.
(C) Sequence alignment of abH112 and hAB17A. Lipid binding motif is colored blue, GXSXG serine hydrolase motif is shown in gold, and catalytic triad is shown in red.
(D) Western blotting of abH112 cKD lines grown in +/− aTC. Data were measured by ChemiDoc™ MP Imaging System (Biorad), with bip used as a loading control.
(E) Plot of abH112 expression levels from (D) normalized to Bip.
(F) Plot of growth levels of parent WT cells (NF54) and abH112 cKD parasites in the presence or absence of aTC. Means are plotted ± SEM (n = 3). Tests for significance used a two-way-ANOVA.
G) Plot of EC50 values of parasites for compound 22 in the WT parent cells (NF54) and in the cKD lines in the presence and absence of aTc. EC50s are plotted as means ± SEMs (N, n = 4–5, 2) and statistical significance determined using Mann-Whitney U tests comparing the parental data vs the abH112 cKD line where *p < 0.05.

