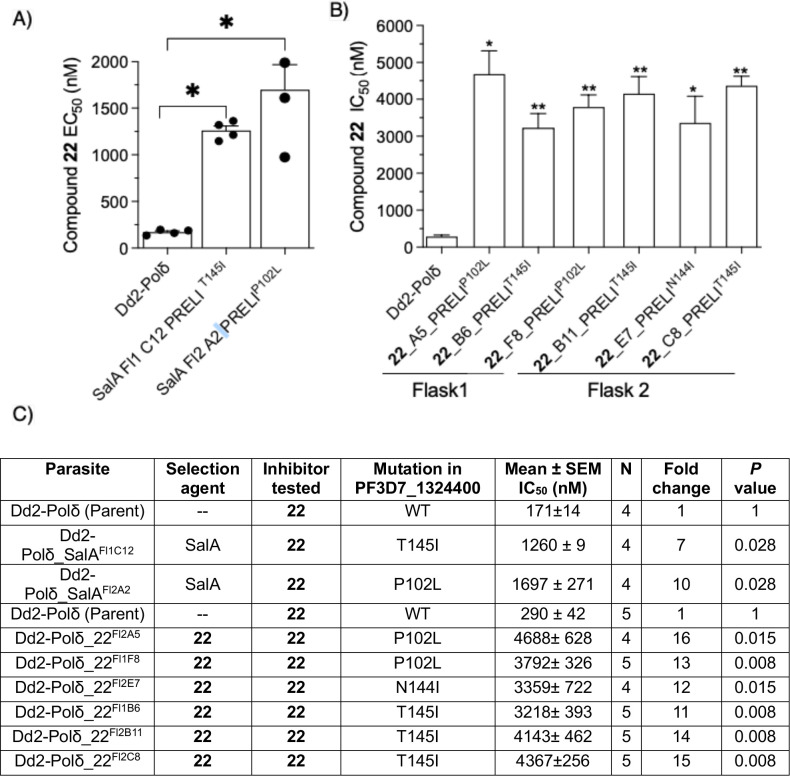
Figure 6: Cross resistance and in vitro selection of parasites.
(A) Plot of EC50 values for two SalA resistant lines (harboring mutations in PRELI domain-containing protein at positions P102L and N145I) for compound 22. Values are plotted as means ± SEMs and statistical significance determined using Mann-Whitney U tests where *p < 0.05.
(B) EC50 shifts of mutant and parental lines against 22. EC50s for each line are presented as means ± SEMs (N, n = 4, 2) and statistical significance determined using Mann-Whitney U tests comparing the parental data vs the mutant line where *p < 0.05.
(C) Summary table of EC50s for each line are presented as means ± SEMs (N, n = 4, 2). EC50s for each line are presented as means ± SEMs (N, n = 4, 2) and statistical significance determined using Mann-Whitney U tests comparing the parental data vs the mutant line where *p < 0.05.

