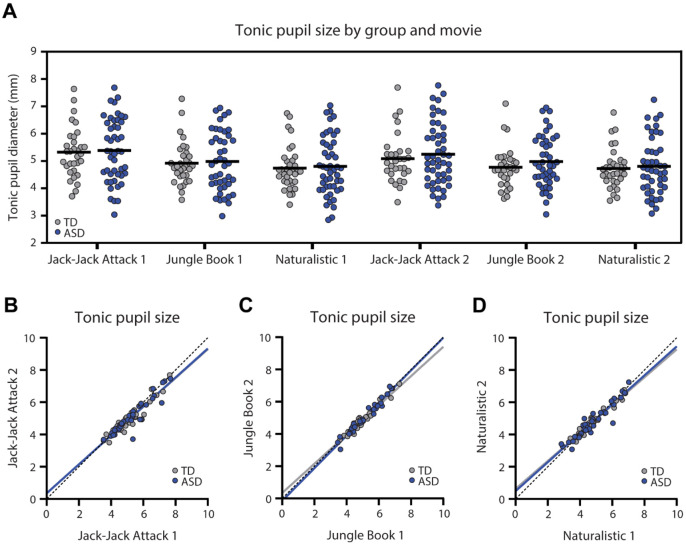
Figure 1:
Tonic pupil diameter (mm) in each of the six movies. A. Scatter plot demonstrating tonic pupil diameter for each individual, across both groups, per movie. Black line: mean tonic pupil diameter per group. There were no significant differences across groups. B-D. Scatter plots demonstrating stability of tonic pupil diameter per participant across two presentations of each movie. Each point represents a single child. Solid lines: Least squares fit. Dotted line: unity line. Blue: ASD, Gray: TD.

