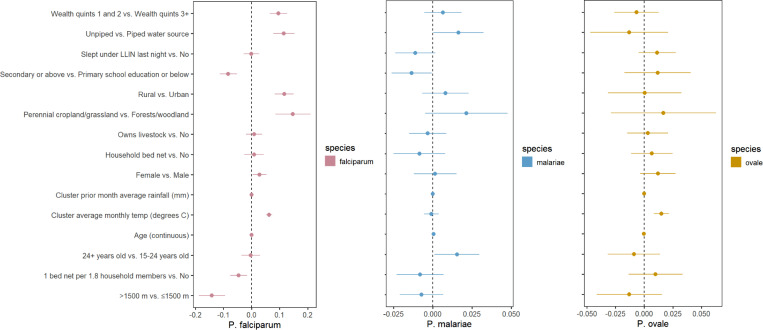
Figure 4. Bivariate associations and between demographic and environmental risk factors and Plasmodium spp. prevalence using weighted survey data.
Models incorporate 2014–15 Rwanda Demographic and Health Survey weights, inverse probability of selection weights, and cluster transmission intensity weights (described in Table 1). Point estimates of prevalence difference are surrounded by confidence intervals. The reference is the second variable listed. Panel A, B and C represent P. falciparum, P. malariae, and P. ovale sp., respectively. Note that each panel has a different scale.

