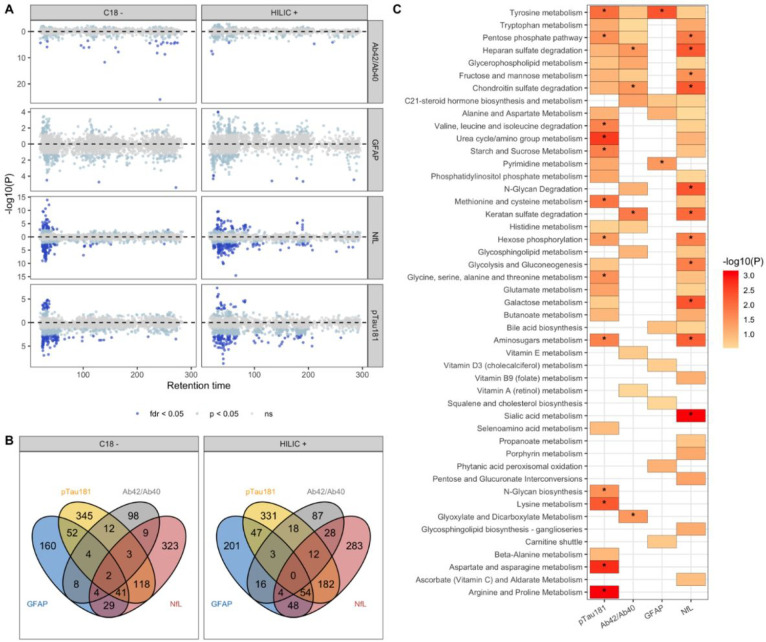
Figure 2: Metabolic features and pathways associated with plasma-based biomarkers of AD.
In A, a modified Miami plot shows features with positive beta values above the zero line and those with negative beta values below the zero line. The dark blue points indicate features with FDR q-value < 0.05 for data obtained for each column (C18 and HILIC). In B, the overlap in features associated with the four biomarkers at nominal p < 0.05 (light blue and dark blue points) for each column. In C, the metabolic pathways, with Fisher’s exact test p < 0.3, enriched by features nominally associated with the biomarkers. An asterisk indicates pathways that were significantly enriched (p < 0.05). 42/40: ratio of A 42 to A 40 measured in plasma, GFAP: glial fibrillary acidic protein, NfL: neurofilament light chain, pTau181: tau phosphorylated at threonine-181.

