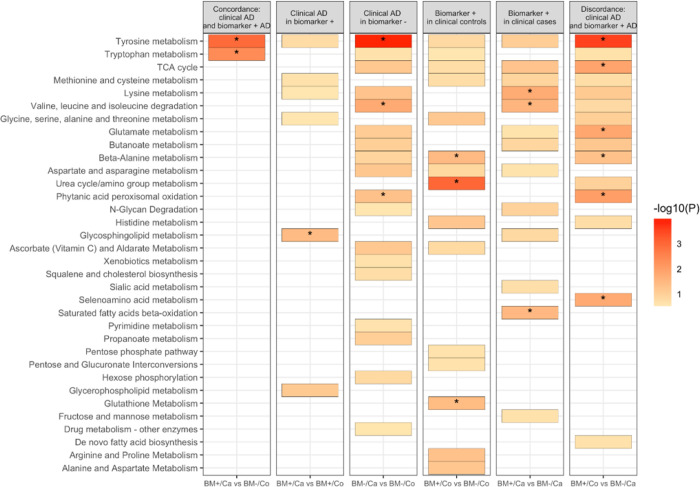
Figure 3: Subgroup analysis based on clinical diagnosis and biomarker positive status.
Results from multinomial and regular logistic regression were used to determine metabolic pathways enriched. A colored box indicates an enriched pathway with Fisher’s exact test p-value < 0.3 while an asterisk indicates statistically significant enrichment (p < 0.05).

