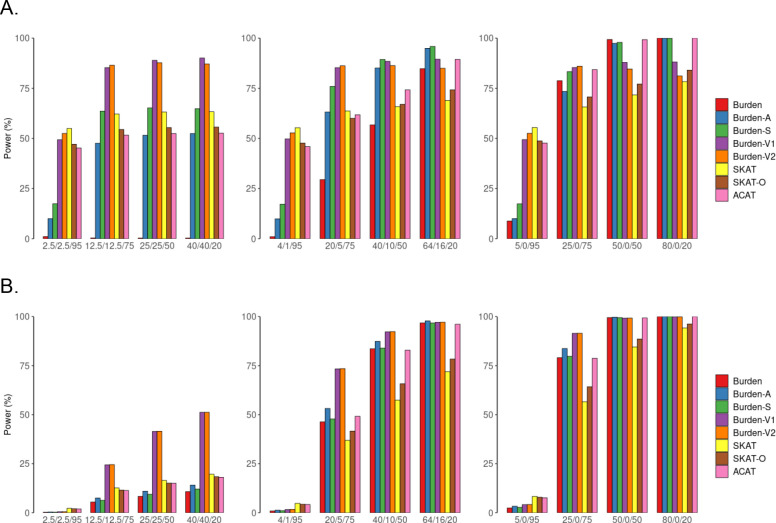
Figure 1. Simulation-based power comparisons of six gene-based tests and two omnibus tests with a continuous and a binary trait by coding definition 1 (adjusted for empirical type I error rate.
Power estimation for a continuous trait (A) and a binary trait (B) at α=0.001. Heteroplasmic variants are defined by an indicator function (definition 1). In simulations, we consider 5%, 25%, 50% or 80% of the nonsynonymous heteroplasmies in CYB gene to be causal and consider that 50%, 80% and 100% of the causal heteroplasmic variants have effects with the same directionality. The variance that was explained by causal mutations was set to be 1% for the continuous trait and 2% for the binary trait. Burden, original burden test; Burden-A, adaptive burden test; Burden-S, z-score weighting burden test; Burden-V1, variable threshold burden test with minimum p value; Burden-V2, variable threshold burden test with ACAT p value combination method; SKAT, sequence kernel association test; SKAT-O, sequence kernel association test-optimal test; ACAT, aggregated Cauchy association test combining burden and SKAT. We simulated 50,000 replicates for evaluating power.

