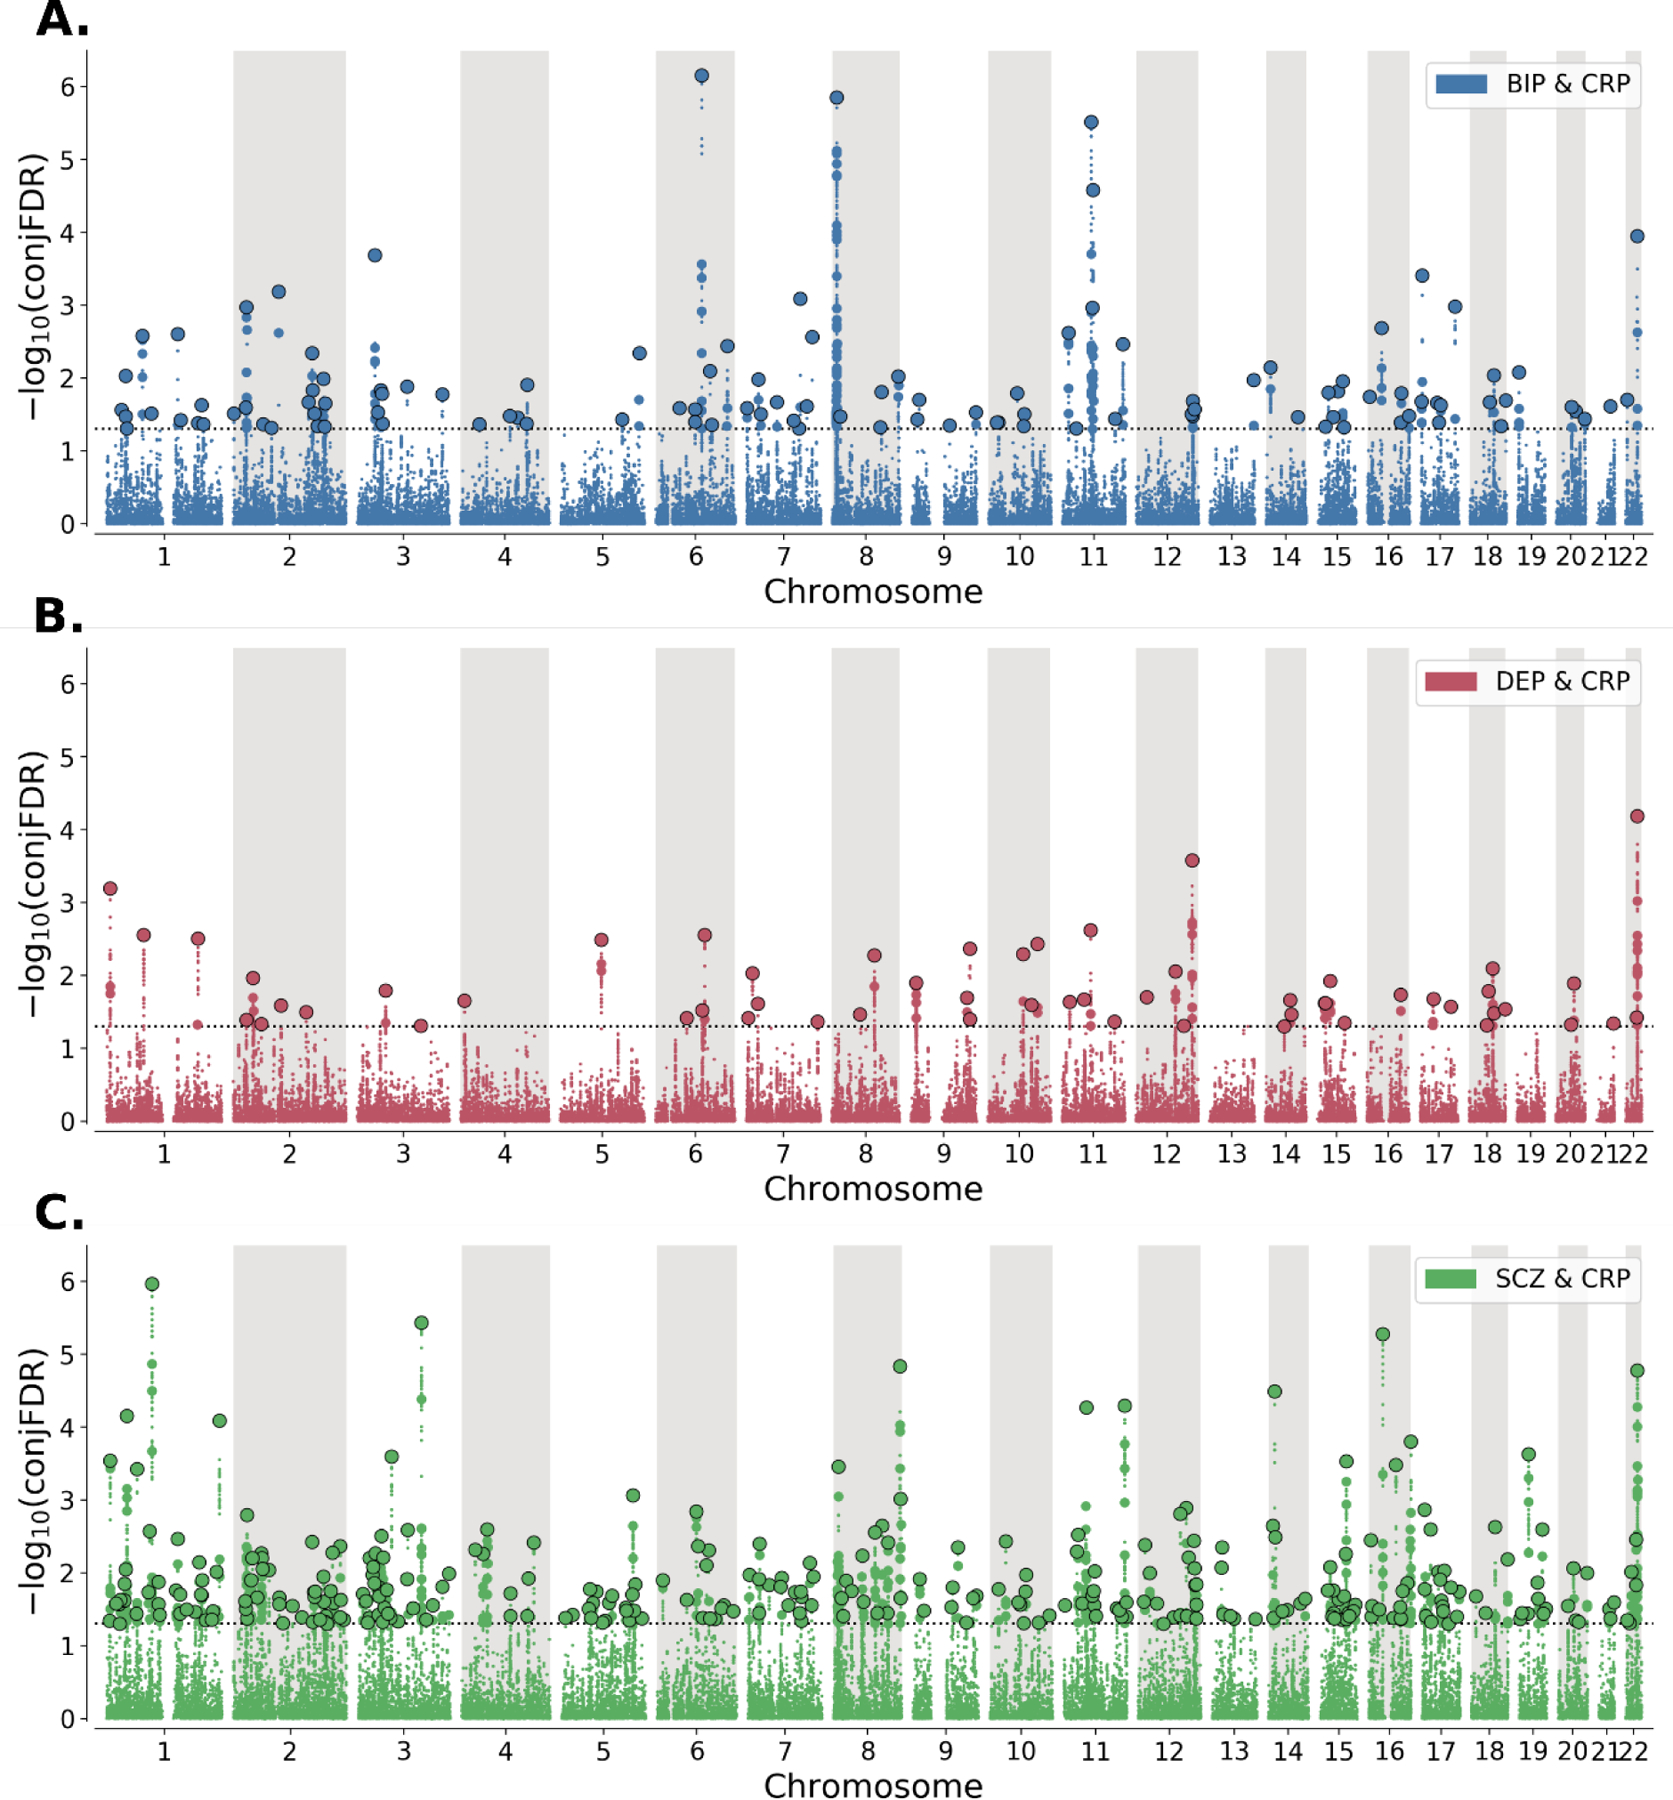
Figure 3: Chromosomal distribution of shared genetic loci between C-reactive protein level (CRP) and A. bipolar disorder (BIP, blue), B. depression (DEP, orange), and C. schizophrenia (SCZ, green).

−log10conjFDR values (y-axis) are plotted against chromosomal position (x-axis). The threshold for statistical significance (conjFDR<0.05) is represented by the dashed line. Lead SNPs are represented by large black-outlined circles, independent significant SNPs are represented by medium-sized coloured circles, and all other SNPs are represented by small circles.
