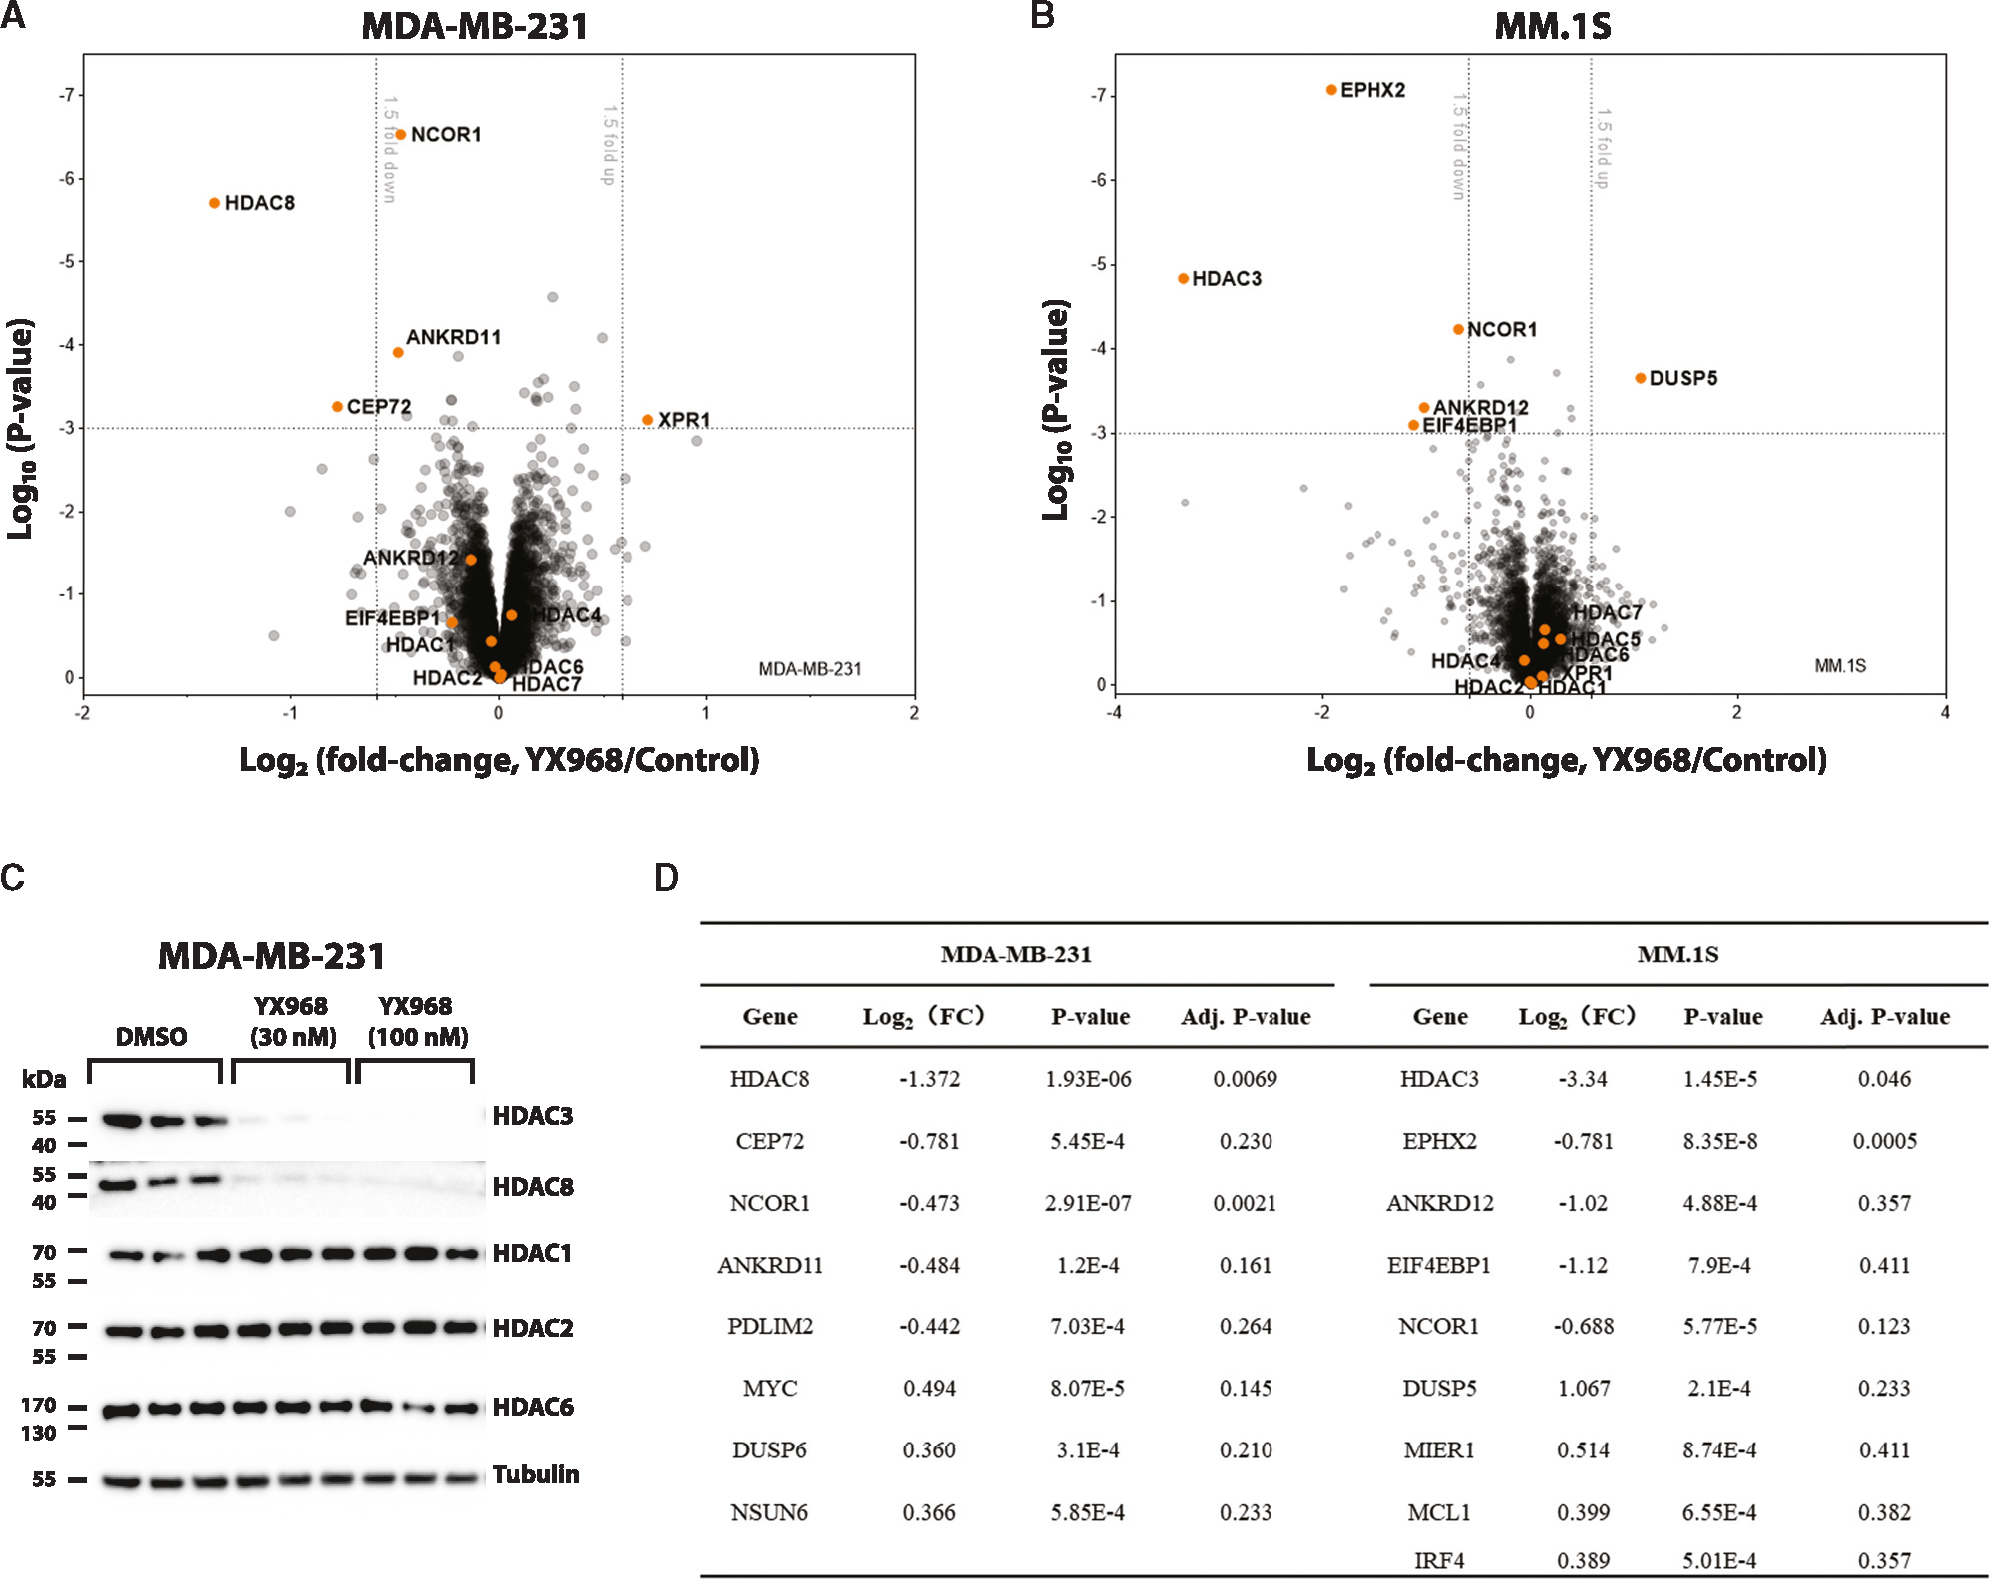
Figure 4. Proteomic profiling of YX968-mediaded degradation.

(A) A scatterplot depicting the log2(fold change) of relative protein abundance in MDA-MB-231 cells treated with YX968 (100 nM, 2 h) compared to those treated with DMSO in TMT proteomic profiling.
(B) A scatterplot depicting the log2(fold change) of relative protein abundance in MM.1S cells treated with YX968 (50 nM, 3 h) compared to those treated with DMSO in diaPASEF based label-free proteomic profiling.
(C) Western blot confirmation of HDAC3/8 degradation of the cell lysates used for TMT profiling in three replicates in MDA-MB-231 cells in (A).
(D) Top hits identified by TMT (A) and diaPASEF (B) proteomic profiling. See also Table S2.
