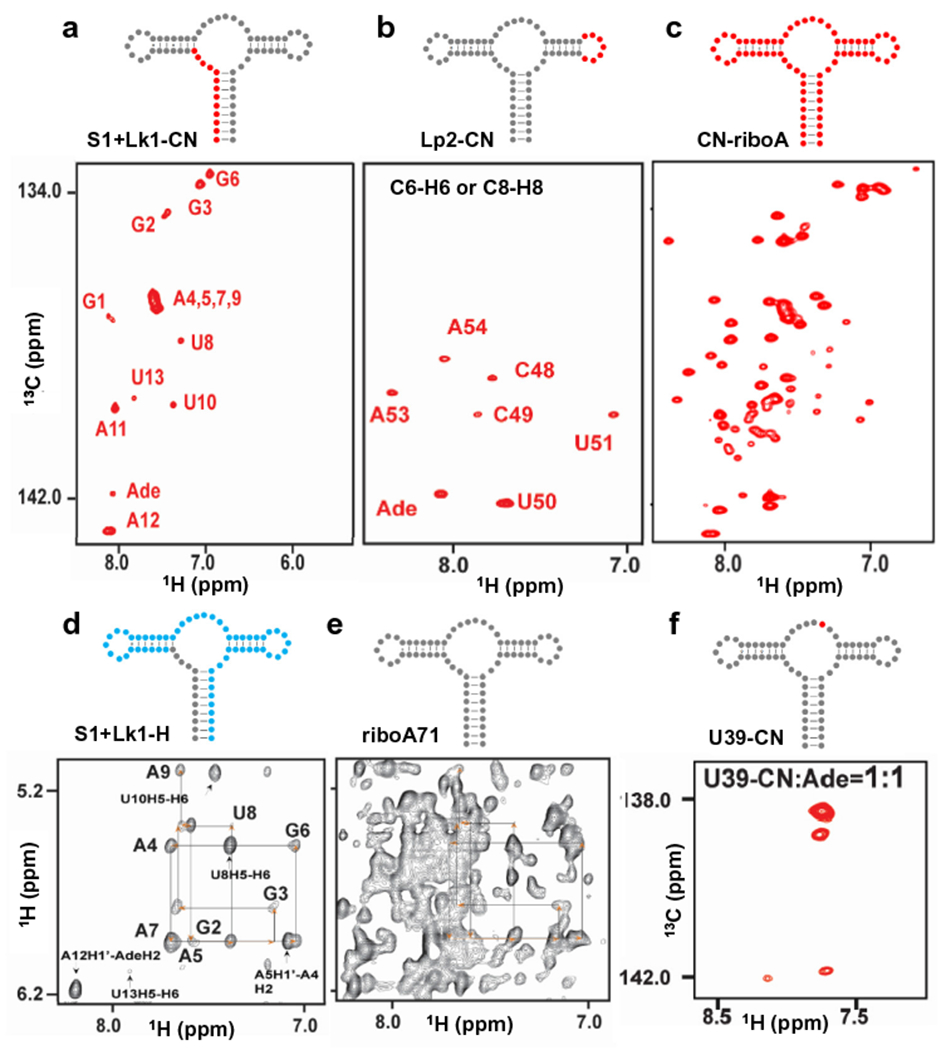
Fig. 3.

PLOR-generated NMR and FRET samples. a–c, The C6/C8-H6/H8 region of the 1H13C-TROSY spectra of a, S1 + Lk1-CN-riboA71, b, Lp2-CN-riboA71, c, CN-riboA71 (uniformly 13C15N-labeled, synthesized by using conventional in vitro liquid-phase transcription), and f, U39-CN-riboA71. d–e, The H1′/H5-H6/H8 region of the 1H1H-NOESY spectra of d, S1 + Lk1-H-riboA71, and e, riboA71. 13C15N-labeled, 2D-labeled and non-labeled residues are shown in red, blue, and grey dots, respectively. The “Ade” in the assignments refers to the ligand adenine. NMR spectra were collected using an 850 MHz Bruker magnet at 25 °C with 0.3–0.5 mM RNAs in 0.5–5 mM adenine. This figure is adapted from reference [27].
