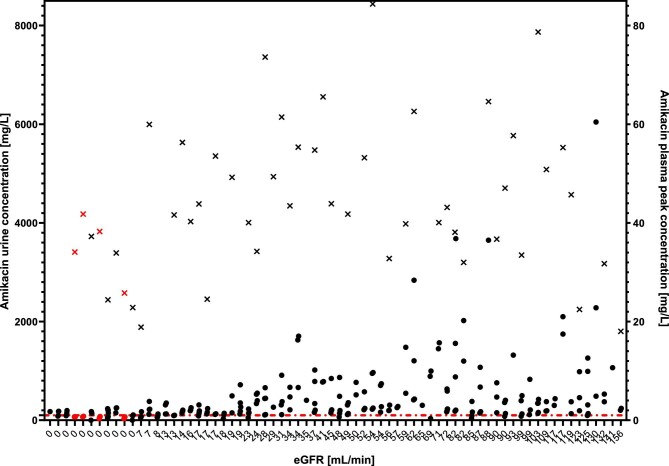
Figure 6:
All measured urine levels of AM and calculated peak plasma levels of AM. Circles: measured AM urinary concentration; crosses: calculated peak AM plasma concentrations; red line: minimum concentration for reliable efficacy against E. coli (100 mg/L). Patients with all measured urinary concentrations below target concentration are colored in red. 0: patients treated by dialysis.

