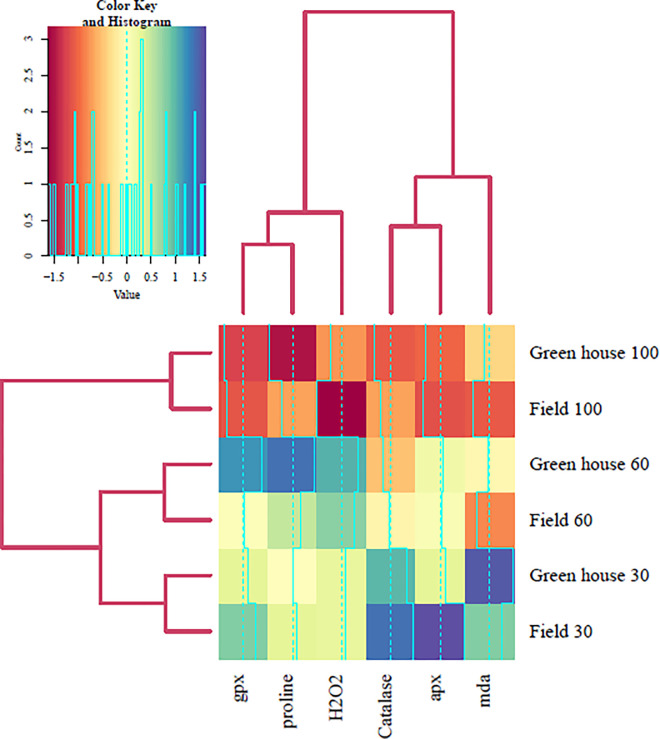
Fig 5. Shows the heatmap and cluster analysis of physiological parameters for both field and greenhouse conditions under different levels of drought stress.
The levels of drought stress were 100 (well-watered), 60 (mild stress), and 30 (severe stress). The heatmap indicates the relative values of the physiological parameters, with darker colors representing higher values and lighter colors representing lower values. The cluster analysis shows the similarity of the physiological parameters and the drought stress treatments based on the Euclidean distance method. The dendrograms on the top and left sides of the heatmap represent the hierarchical clustering of the physiological parameters and the drought stress treatments, respectively.

