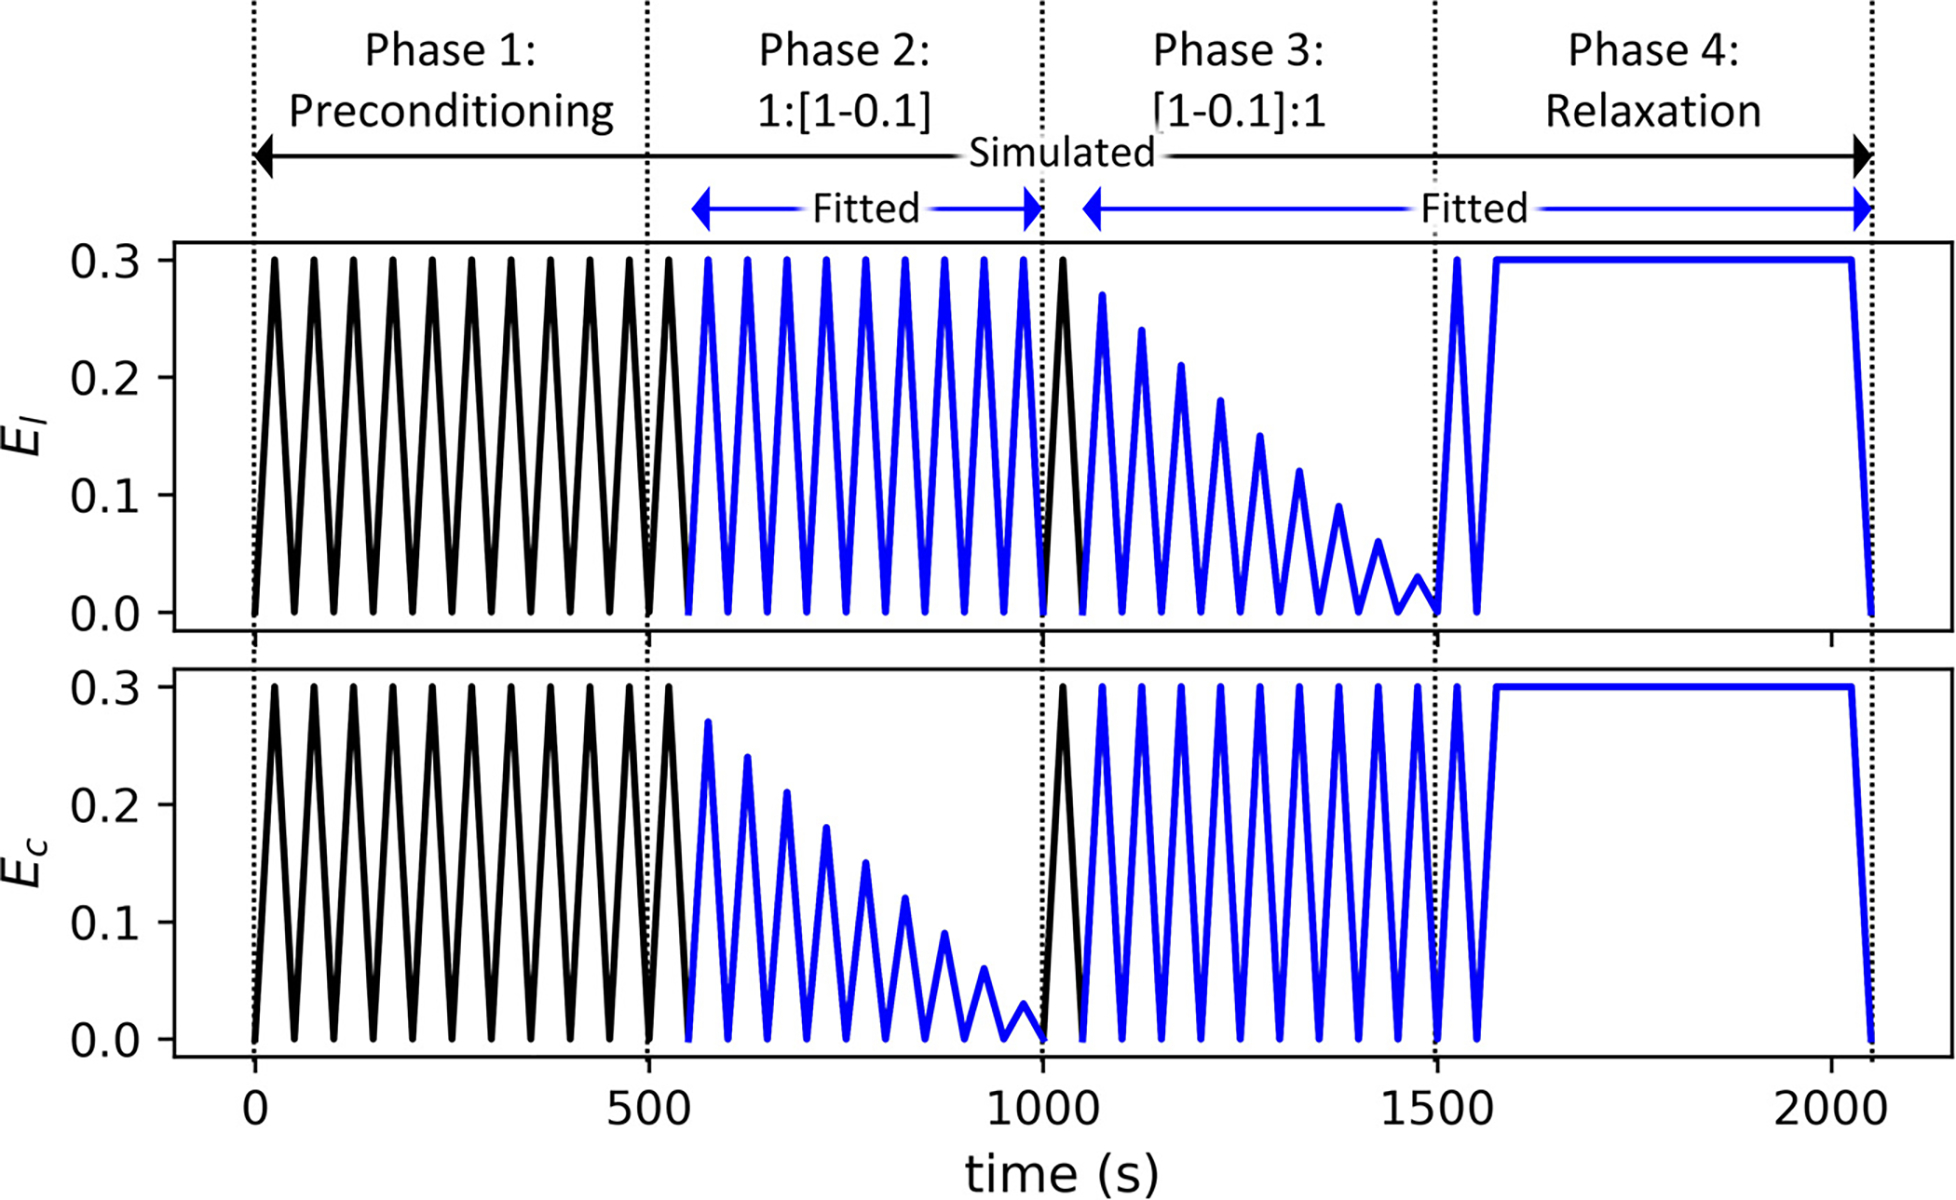
Fig. 2.

Graphical representation of the loading protocols showing the stretch in the longitudinal direction and in the circumferential direction of each cycle. There are four phases: preconditioning, decreasing ratios of circumferential stretch, decreasing ratios of longitudinal stretch, and stress relaxation. Black curves are simulated, but only the blue curves are used in parameter estimation. (For interpretation of the references to color in this figure legend, the reader is referred to the web version of this article.)
