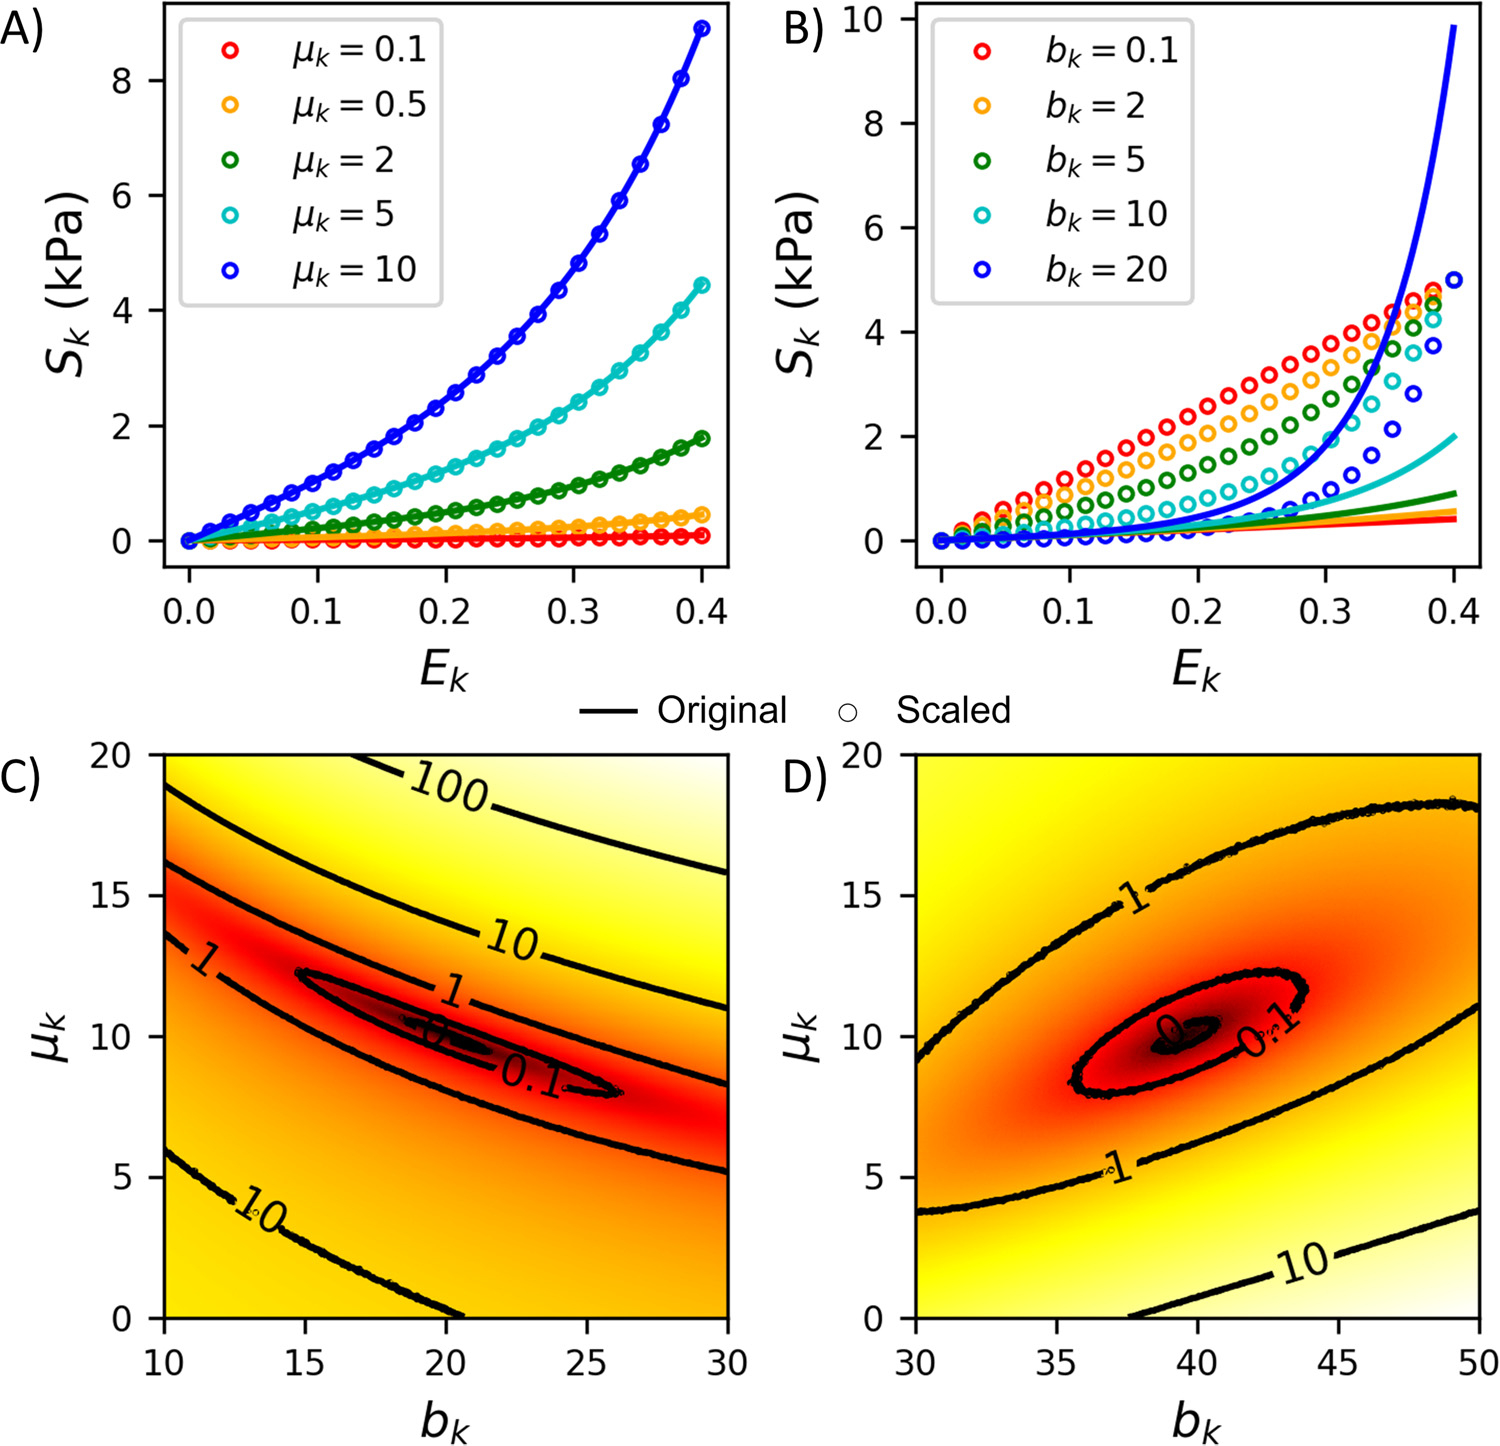
Fig. 4.

Illustration of how varying the modulus and exponent of the fiber model (Eq. (8)) changes after applying the scaling (Eq. (14)). A) Changes in the stress-strain curve as the modulus ( and the equivalent scaled modulus ) is varied. B) Changes in the stress-strain curve as the exponent is varied. The local contours for the objective function with C) the original (Eq. (8)) and D) the scaled models (Eq. (14)) are also shown.
