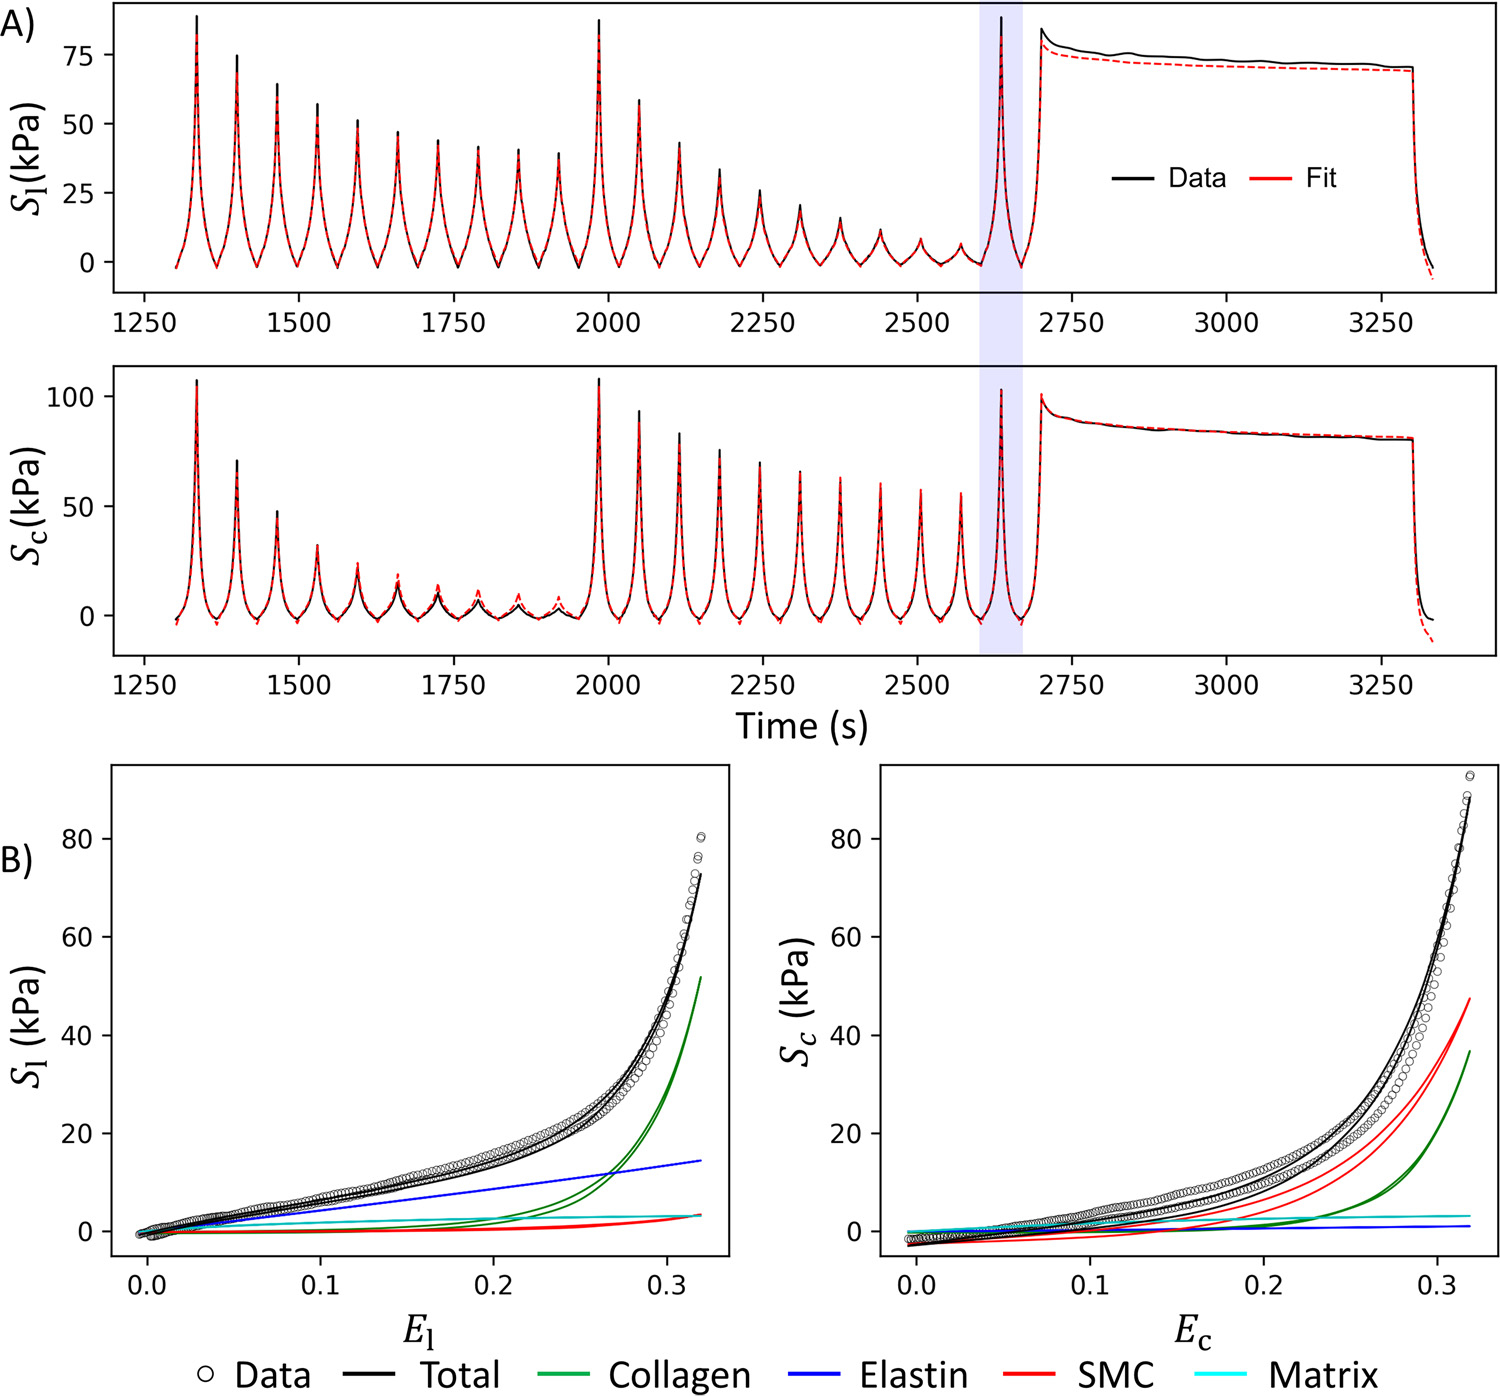
Fig. 5.

Representative fit of the experimental data: A) Data versus fit over time for all loading cycles after preconditioning, including the unfitted cycles. B) Best fit for the last equibiaxial loading cycle (blue shaded curve in A) illustrating the hysteresis and contribution of each tissue component. is the second Piola-Kirchhoff stress in the longitudinal direction, and is the stress in the circumferential direction, while and are the stretches in the longitudinal and circumferential directions, respectively.
