Figure 5.

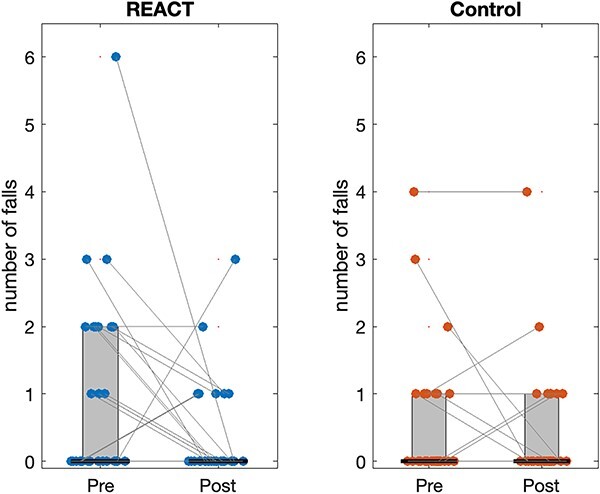
Total number of daily life falls. The dots indicate individual participants, with lines connecting their pre- and postintervention measurements. The horizontal black lines indicate the group medians.

Total number of daily life falls. The dots indicate individual participants, with lines connecting their pre- and postintervention measurements. The horizontal black lines indicate the group medians.