
Fig. 3. Multi-tissue proteomics profiling of TREM2 variant carrier status.
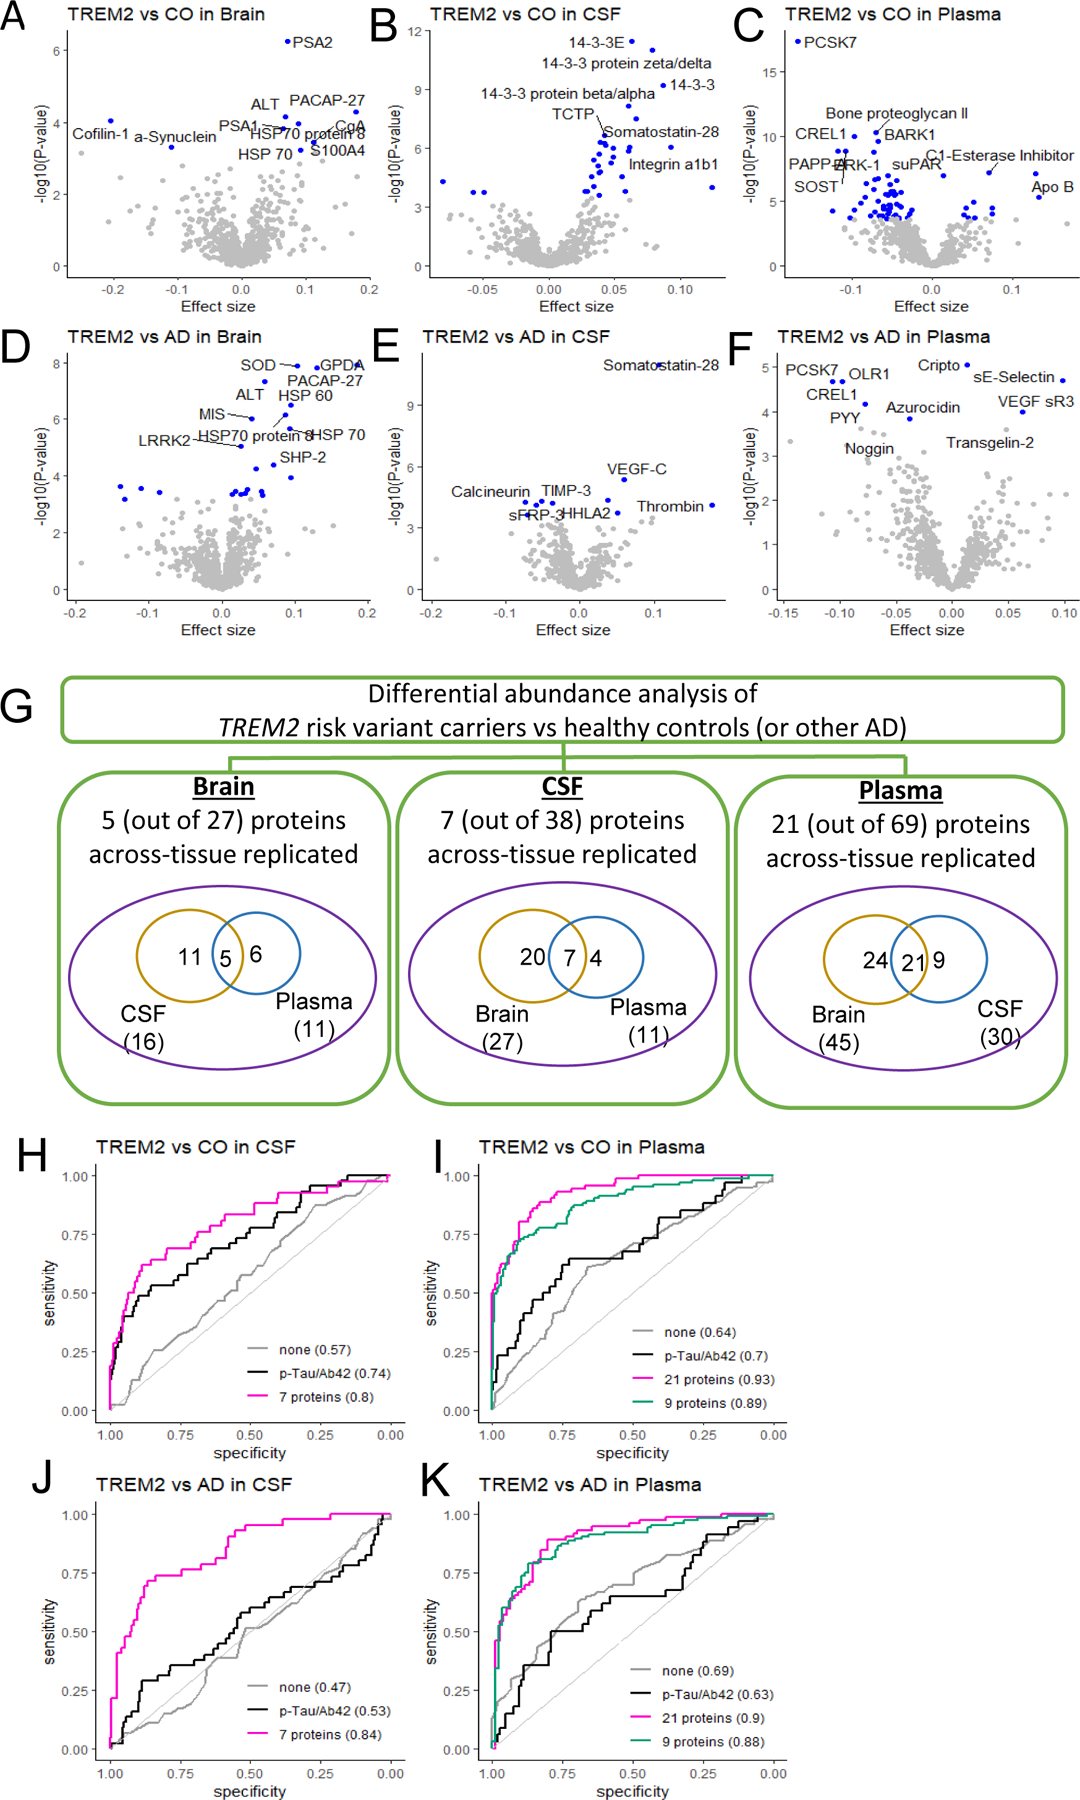
(A) Summary showing identified and across-tissue replicated proteins in three tissues. Multiple proteins showed differential abundance in TREM2 variant carriers (compared to controls or other sporadic AD cases) in at least one of the three tissues, several of which are replicated across tissue. (B) Volcano plots for brain, CSF, and plasma tissue. Differential abundance between TREM2 variant carriers and healthy control (CO) groups (at top panels) or other AD (at bottom panels) are in x-axis and –log10(P-value) for statistical significance are in y-axis. While the top 10 proteins are labeled here, the volcano plots in the web portal ((omics.wustl.edu/proteomics) support interactive exploration for all proteins. (C) Tissue-specific prediction models, including sex and age as covariates. ‘None’ corresponds to the model including age and sex only, without any proteins or other biomarkers.