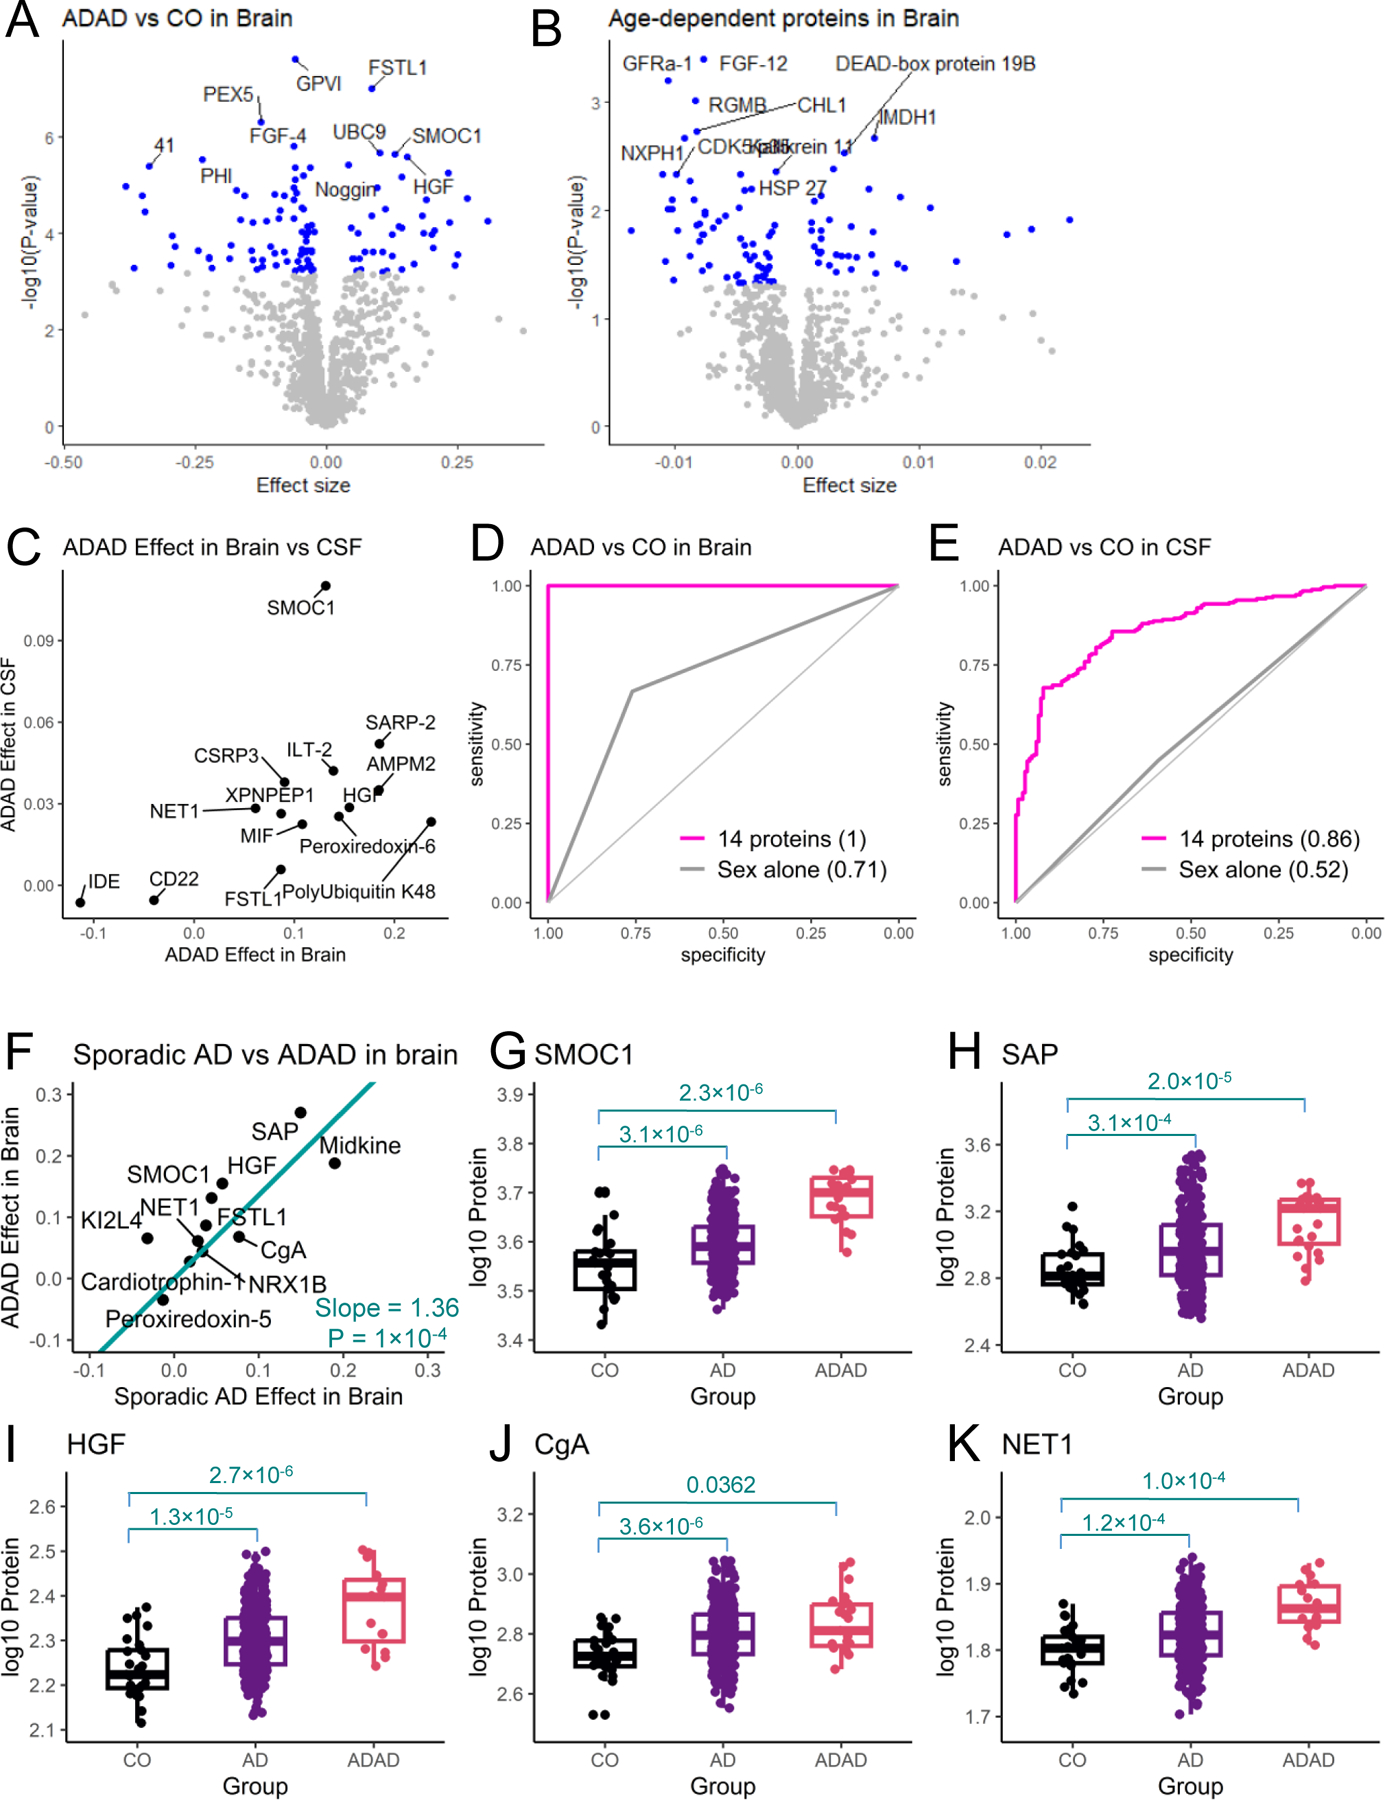
Fig. 4. Proteomic profiling of autosomal dominant AD (ADAD) status.

(A) Volcano plots of differential abundance analysis between individuals with ADAD and healthy control (CO) groups. (B) Volcano plots of differential abundance analysis of age dependent proteins in the brain. (C) The scatterplot of the 14 proteins replicated in CSF and their prediction models in brain and CSF. (D) The scatterplot of the 12 proteins associated with sporadic AD status. The effect of ADAD status on log-transformed protein abundance is in y-axis, and the effect of AD status is in x-axis. The box plots for the select 5 proteins are displayed.
