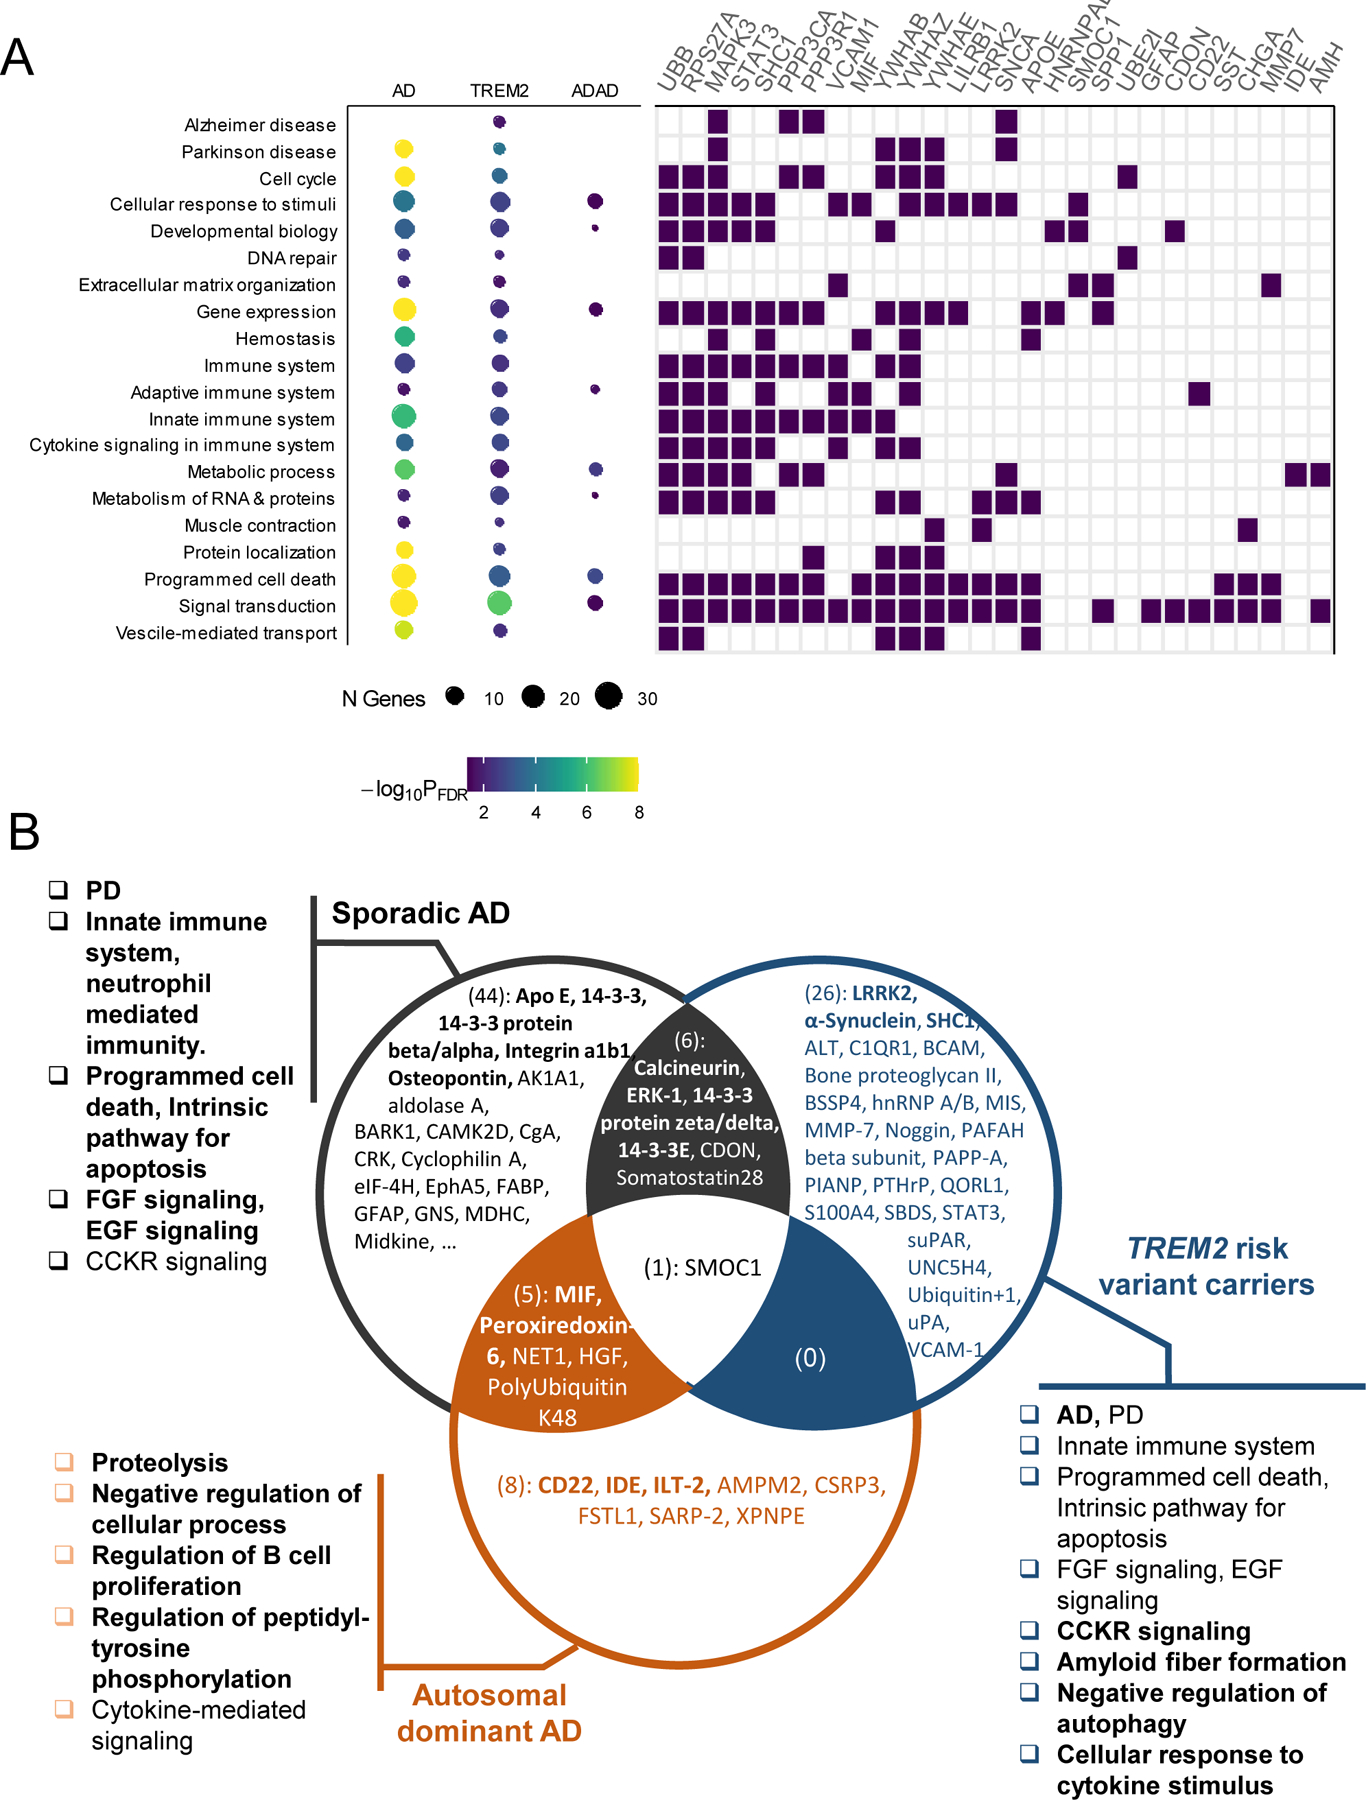
Fig. 5. Pathway enrichments for sporadic and genetically defined AD.

(A) The dot chart (on the left, size corresponding to the number of identified genes and color corresponding to the FDR corrected significance, table S25). The tile plot (on the right) show genes that belong to the specific pathway. A full list of 81 genes is shown in fig. S12. (B) The Venn diagram shows overlap of identified proteins across the three groups: 56 externally replicated proteins for sporadic AD, 33 across-tissue replicated proteins for TREM2, 14 proteins replicated in DIAN CSF data for ADAD. Proteins mentioned in Pathway section are in boldface (for example, Apo E). The pathways highlighted in Pathway section are included. The most enriched pathways across 3 groups are in boldface.
