Figure 5.

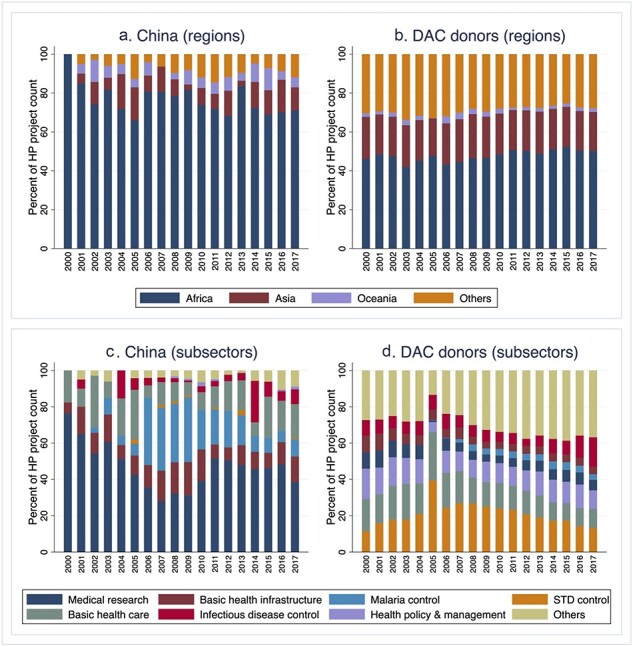
Distribution of HP commitments across regions ((a) China and (b) DAC) and CRS subsectors ((c) China and (d) DAC) by year from 2000 to 2017, measured by the HP project count. Data source: AidData 2.0 and CRS datasets.

Distribution of HP commitments across regions ((a) China and (b) DAC) and CRS subsectors ((c) China and (d) DAC) by year from 2000 to 2017, measured by the HP project count. Data source: AidData 2.0 and CRS datasets.