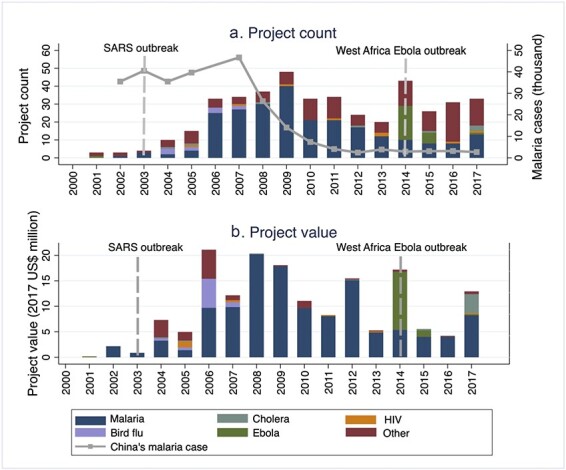
Figure 7.

Chinese HP projects by specific communicable disease, by year (2000 to 2017), measured by (a) Project count and (b) Project value (median imputation). Two reference lines correspond to the outbreak of SARS in China and Ebola in West Africa. The line graphs illustrated new malaria cases number in China overtime. Data sources: AidData 2.0 and surveillance reports on China’s notifiable infectious diseases of National Health Commission of China (2003-2017).
