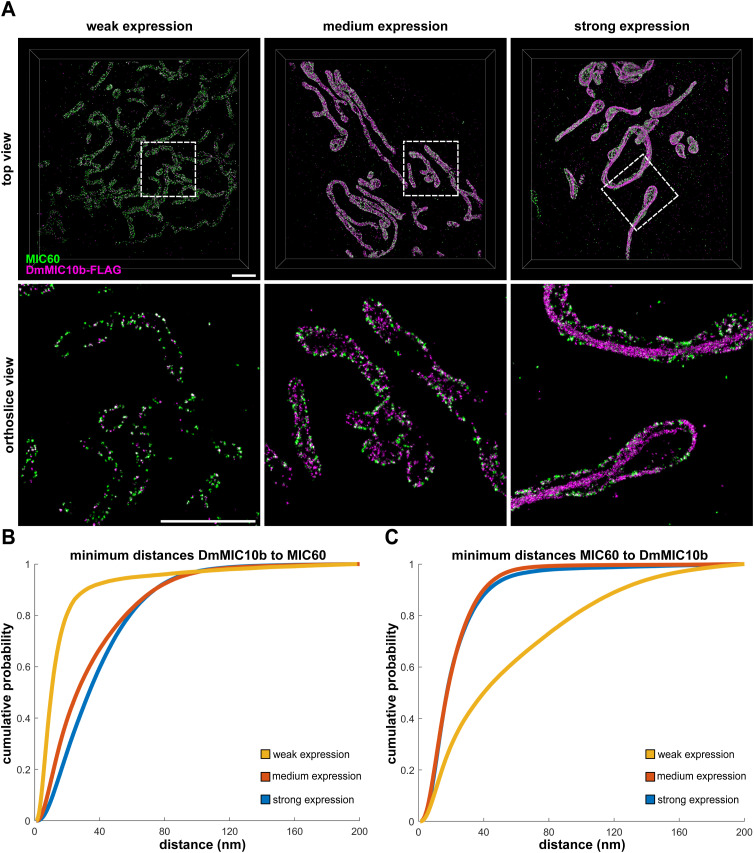
Figure S5. Nanoscale distribution of DmMIC10b in COS-7 cells.
(A, B, C) DmMIC10b-FLAG was transiently expressed in COS-7 cells. Cells were fixed, immunolabeled against MIC60 and the FLAG epitope, and recorded by 4Pi-STORM. (A) Representative 4Pi-STORM recordings of cells with different expression levels of DmMIC10b. Volume rendering (upper) and ortho-slice view of the area indicated by dashed lines (lower). (A, B, C) Nearest neighbor analysis of the 4Pi-STORM recordings shown in (A). (B) Minimum distances of DmMIC10b localizations to MIC60. At low expression levels, most of the DmMIC10b events are close to MIC60, indicating a strong co-localization. (C) Minimum distances of MIC60 localizations to DmMIC10b. Scale bars: 2 μm.

