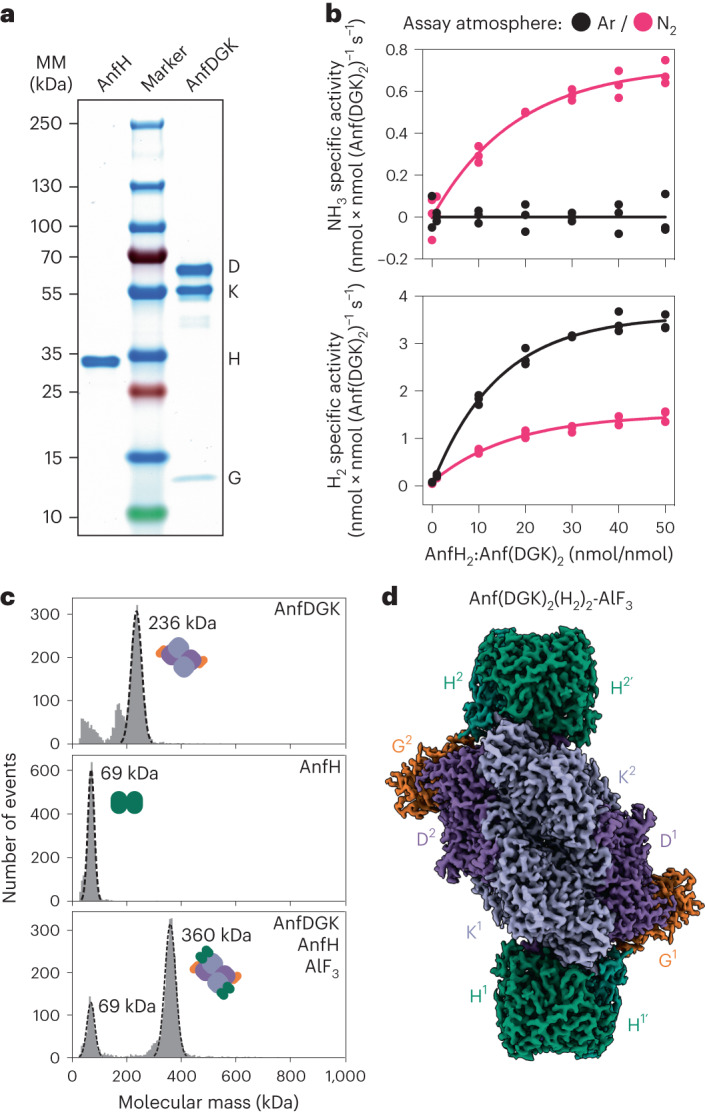
Fig. 1. Purification and biochemical characterization of the Fe nitrogenase.

a, SDS–PAGE analysis of the purified Fe nitrogenase reductase component (AnfH) and catalytic component (AnfDGK). MM, molecular mass. b, In vitro activity assays of the purified Fe nitrogenase under Ar or N2 atmosphere. Plotted are the specific activities for NH3 (top) or H2 (bottom) formation under varying molar ratios of AnfH2 to Anf(DGK)2. Individual measurements (n = 3) are shown, and the solid line represents the non-linear fit of the data. c, Mass photometry analysis of the individual nitrogenase components (top and middle) and the AlF3-trapped Anf(DGK)2(H2)2 complex (bottom). Plotted are the number of events versus the molecular mass of the individual events (in kDa). d, Electron density map of the AlF3-trapped Fe nitrogenase complex at a global resolution of 2.35 Å (EMD-16890).
