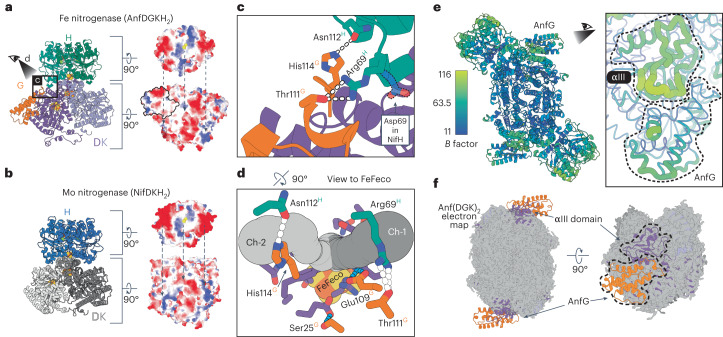
Fig. 3. Potential roles of AnfG in the Fe nitrogenase complex.
a, Left: Depiction of the AnfDGKH2 subcomplex. Right: Electrostatic potentials of the AnfH2 (top) and AnfDGK (bottom) interaction surfaces. Negative charges are in red, neutral in white and positive in blue. Arrows indicate interaction interfaces with complementary charges. AnfG is outlined in black. b, Left: Depiction of the NifDKH2 subcomplex (modified from PDB 7UTA). Right: Electrostatic surface potentials as shown in a. c, Close-up view of the AnfG–AnfH interaction interface as highlighted in a. Hydrogen bonds between amino acid residues are indicated by white dashes. Shown in faint blue is Asp69NifH that replaces Arg69AnfH in the Mo nitrogenase complex (PDB 7UTA), exemplifying the reverse interaction characteristics of the two reductase components. d, A 90° rotation from the view in c toward the FeFeco showing two CAVER predicted channels to the active site (Ch-1 and Ch-2; tubes in different shades of gray) and an N2 channel calculated using molecular dynamics proposed by ref. 48 (purple residues). Light-blue dashes highlight interactions of AnfG residues Ser25AnfG and Glu109AnfG with residues of the channel calculated using molecular dynamics. White dashes depict the same interactions highlighted in c. e, Left: Per-atom B factors within the Fe nitrogenase complex. Right: Highlight of B factors in the αIII domain and AnfG in putty representation. f, Model of apo-Anf(DGK)2 fitted into the 2.49-Å cryo-EM map of the CHAPSO detergent-treated Anf(DGK)2 sample (PDB 8PBB; EMD-17583). As highlighted by the arrows, electron density for AnfG and parts of AnfD is missing, including the αIII domain and the FeFeco.

