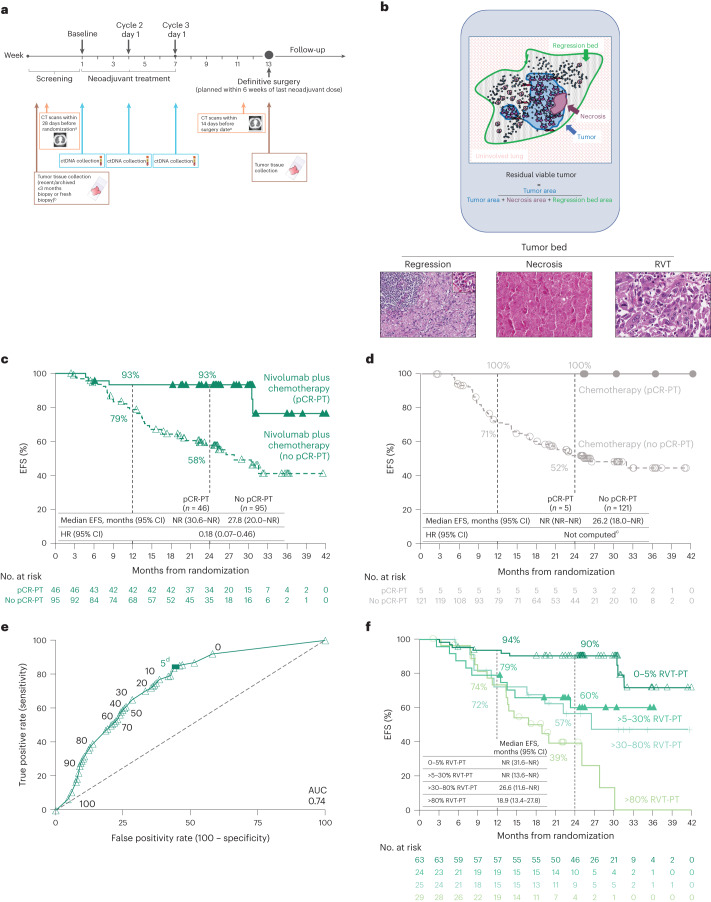
Fig. 1. EFS by pCR and RVT.
a, CheckMate 816 timeline of sample collection for biomarker studies (radiographic imaging (orange), ctDNA (blue) and tumor tissue (brown)). b, Schematic of irPRC scoring. Representative photomicrographs show histologic components of the scoring system. The photomicrograph of regression shows a background zone of fibrosis with neovascularization with numerous TIL. A TLS is present in the upper left corner. The inset highlights a collection of plasma cells, which are commonly seen in areas of regression (hematoxylin and eosin staining). c,d, Kaplan–Meier curves of EFS by pCR status (PT) in the path-evaluable patient population in the nivolumab plus chemotherapy arm (c) and in the chemotherapy arm (d). e, ROC curve analysis of 2-year EFS rate by %RVT (PT) in the path-evaluable patient population for patients treated with nivolumab plus chemotherapy. f, Kaplan–Meier curves of EFS by %RVT categories (PT) in the path-evaluable patient population for patients treated with nivolumab plus chemotherapy. Database lock: 20 October 2021; minimum follow-up: 21 months for nivolumab plus chemotherapy and chemotherapy arms; median follow-up: 29.5 months. CT, computed tomography; EBUS, endobronchial ultrasound; NR, not reached; TIL, tumor infiltrating lymphocyte; TLS, tertiary lymphoid structure. aUsing RECIST1.1. bMediastinal lymph node sampling. All suspicious mediastinal lymph nodes require sampling for pathologic confirmation if accessible by EBUS, mediastinoscopy or thoracoscopy. cHR was not computed for the chemotherapy arm owing to only five patients having a pCR-PT. dThe solid square is the optimal cutoff, which is the difference between the true positive rate and false positive rate over all possible cutoff values.

