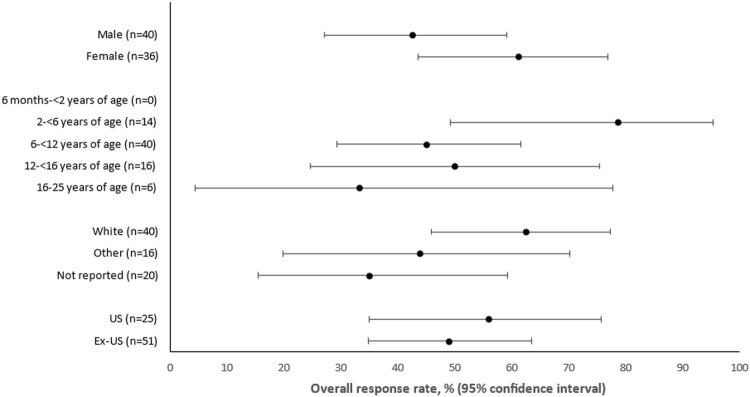
Extended Data Fig. 3. Forest plot of response according to RAPNO in subgroups defined by baseline characteristics.
Filled circles represent the overall response rates, and whiskers represent the 95% confidence intervals. Other races included Asian (n = 5), Black (n = 2), Multiple (n = 3), and Other (n = 6). There were no Native Hawaiian or other Pacific Islander or American Indian or Alaska Native participants. No race information was missing. Ex, External to; US, United States.

