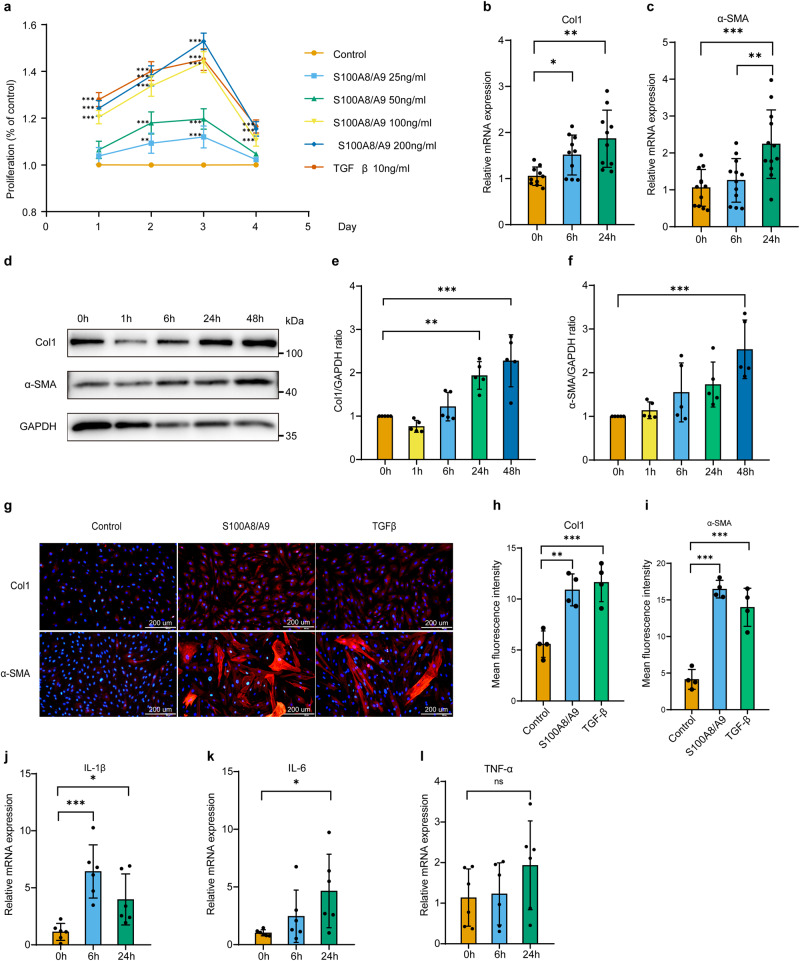
Fig. 2. S100A8/A9 promotes the proliferation and fibrosis of hEnSCs in vitro.
a hEnSCs were exposed to various concentrations (25/50/100/200 ng/mL) of S100A8/A9 or 10 ng/mL TGF-β1 for 1–4 days, and cell proliferation was assessed using the CCK-8 assay, n = 4 per group, two-way ANOVA with Tukey’s multiple comparison test. b Following treatment with 100 ng/mL S100A8/A9 for 6 or 24 h, the expression levels of Col1 mRNA in hEnSCs were measured by RT-PCR, n = 10 per group, Welch’s ANOVA test with Tamhane’s T2 multiple comparisons test. c Following treatment with 100 ng/mL S100A8/A9 for 6 or 24 h, the expression levels of α-SMA mRNA in hEnSCs were measured by RT-PCR, n = 12 per group, ordinary one-way ANOVA with Tukey’s multiple comparison test. d–f After treatment with 100 ng/mL S100A8/A9 for 1, 6, 24, and 48 h, the protein expression of Col1 and α-SMA in hEnSCs was determined by western blot analysis, n = 5 per group, ordinary one-way ANOVA with Dunnett’s multiple comparison test. g–i Following treatment with 100 ng/mL S100A8/A9 or 10 ng/mL TGF-β1 for 48 h, the protein expression of Col1 and α-SMA in hEnSCs was detected by immunofluorescence staining (blue: DAPI, red: Col1 or α-SMA, Scale bar = 200 μm), n = 4 per group, ordinary one-way ANOVA with Dunnett’s multiple comparison test. j–l After treatment with 100 ng/mL S100A8/A9 for 6 and 24 h, the expression levels of IL-1β, IL-6, and TNF-α mRNA in hEnSCs were measured by RT-PCR, n = 6 per group, ordinary one-way ANOVA with Dunnett’s multiple comparison test. Data are presented as means ± SD. *P < 0.05, **P < 0.01, ***P < 0.001 compared with indicated groups. ns, not significant (P > 0.05).

