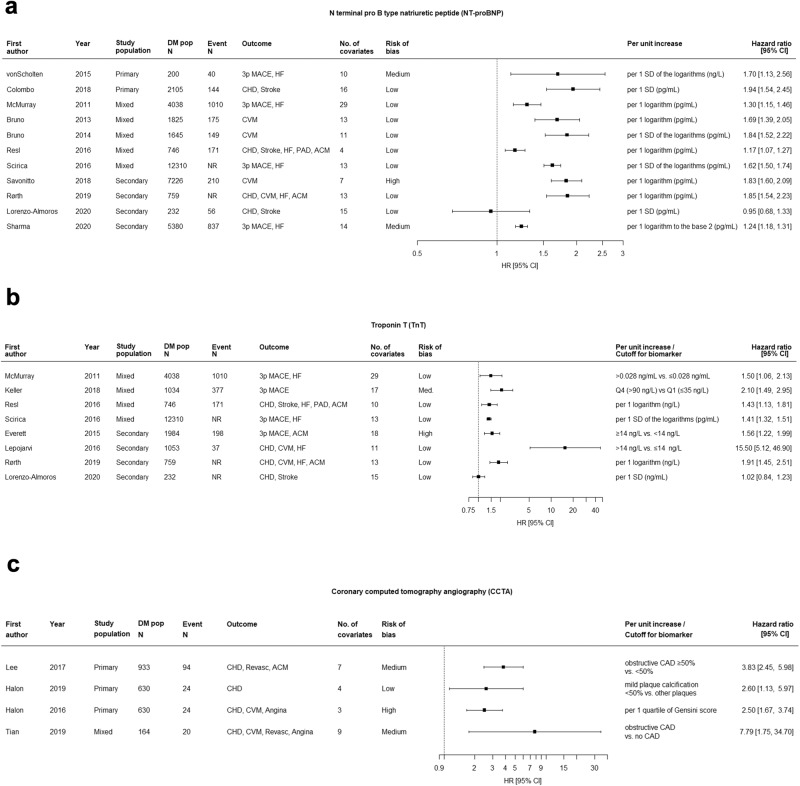
Fig. 5. Forest plots for three biomarkers (NT-proBNP, TnT, and CCTA) with the most evidence for prediction of CVD outcomes.
Panel a (NT-proBNP); Panel b (TnT); Panel c (CCTA). HR hazard ratio, CI confidence interval, DM pop N, sample size for diabetes population; Event N, number of individuals developed CVD outcomes; 3p MACE, 3-point major adverse cardiovascular events; HF heart failure, CHD coronary heart disease, CVM cardiovascular mortality, PAD peripheral artery disease, ACM all-cause mortality.

