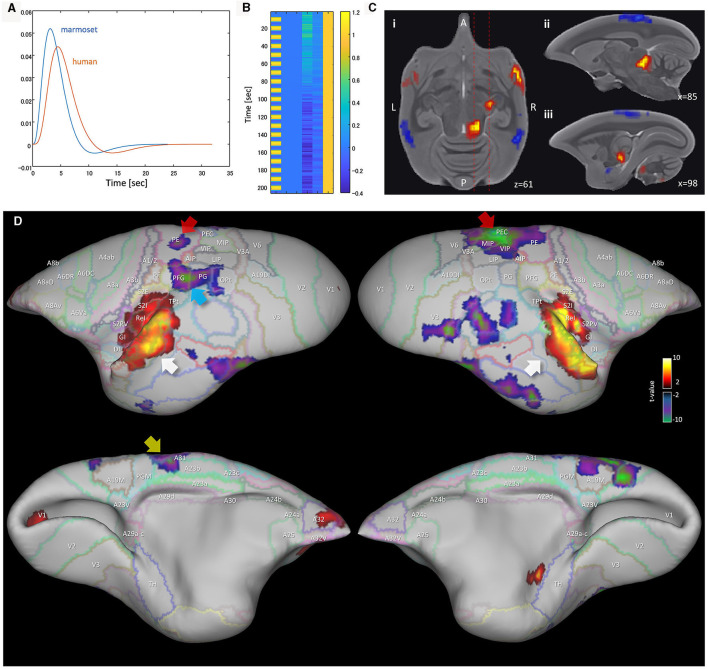
Figure 2.
GLM analysis results of awake marmoset passive auditory task-fMRI. (A) Canonical hemodynamic response function (HRF) for the marmoset and human. (B) Example design matrix for GLM analysis (TR = 3 seconds). (C) GLM analysis result (auditory stimuli > rest) of sub-cortical regions. (i) Horizontal plane (z = 61) of marmoset brain shows several activated regions. (ii) Sagittal plane (x = 85) shows activated region of inferior colliculus. (iii) Sagittal plane (x = 98) shows activated region of medial geniculate nucleus. (D) GLM analysis result (auditory stimuli > rest) mapped to the marmoset cortical surface. White arrow shows activated region of auditory cortex. Red arrow shows deactivated region of PEC, PE. Yellow arrow shows deactivated regions of A23b, A31. Cyan arrow shows the deactivated region of PFG.

