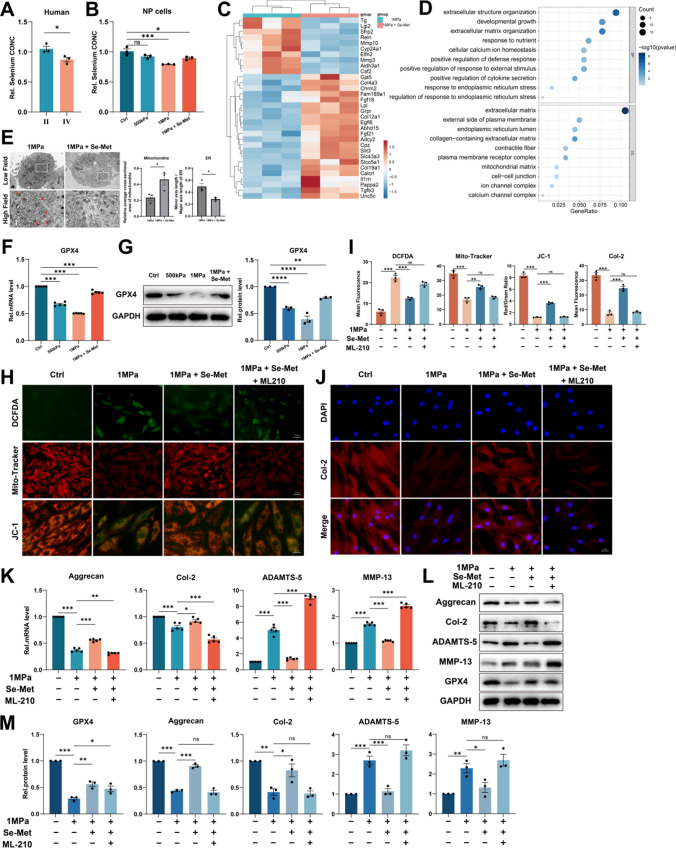
Fig. 4.
Selenium supplementation protects NP cells from ferroptosis by enhancing GPX4 expression. A The concentration of selenium in NP tissues from humans (n = 3 for each group). B The concentration of selenium of NP cells (n = 3 for each group). C Microarray heatmap of rat NP cells from the 1 MPa group, and 1 MPa + Se-Met group (n = 3 for each group). D GO enrichment analysis of the indicated groups. E Representative TEM images and quantitative analysis of rat NP cells from 1 MPa group and 1 MPa + Se-Met group. Arrows show shrunken mitochondria and swollen ER. Scale bars: 2 μm (Low field), 1 μm (High field). F The qPCR of GPX4 of the groups in this Figure (n = 5 for each group). G The Western blotting analysis for GPX4 (n = 3 for each group). H DCFDA assays for ROS level and Mito-Tracker and JC-1 for mitochondrial membrane potential. Scale bar: 50 or 25 μm. I Quantitative analysis of mean fluorescence (n = 3 for each group). J The immunofluorescence of Col-2. Scale bar: 25 μm. K The qPCR of Aggrecan, Col-2, ADAMTS-5, and MMP-13 of the groups in this Figure (n = 5 for each group). L The Western blotting analysis for Aggrecan, Col-2, ADAMTS-5, and MMP-13. M Quantification of Western blotting analysis (n = 3 for each group). Results were shown as mean ± SEM. ns not significant, *p < 0.05, **p < 0.01, ***p < 0.001

