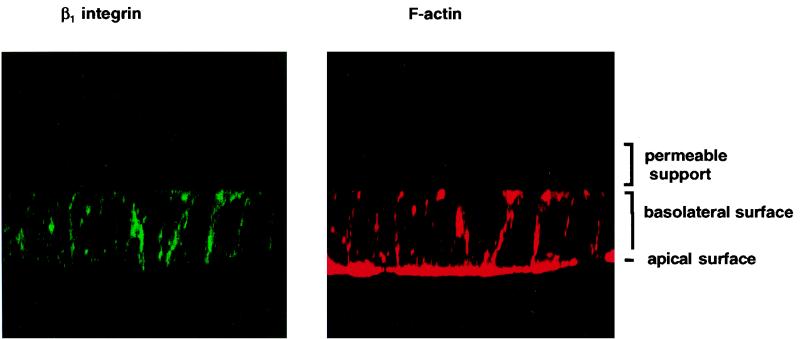
FIG. 2.
T84 cells, 10 days after seeding on permeable supports, analyzed by confocal laser scan microscopy. The green signal in the left panel represents immunolabeling with an antibody specific for β1 integrins. The red signal in the right panel shows F-actin staining with tetramethyl rhodamine isocyanate-conjugated phalloidine. Vertical (x-z) optical sections are shown.

