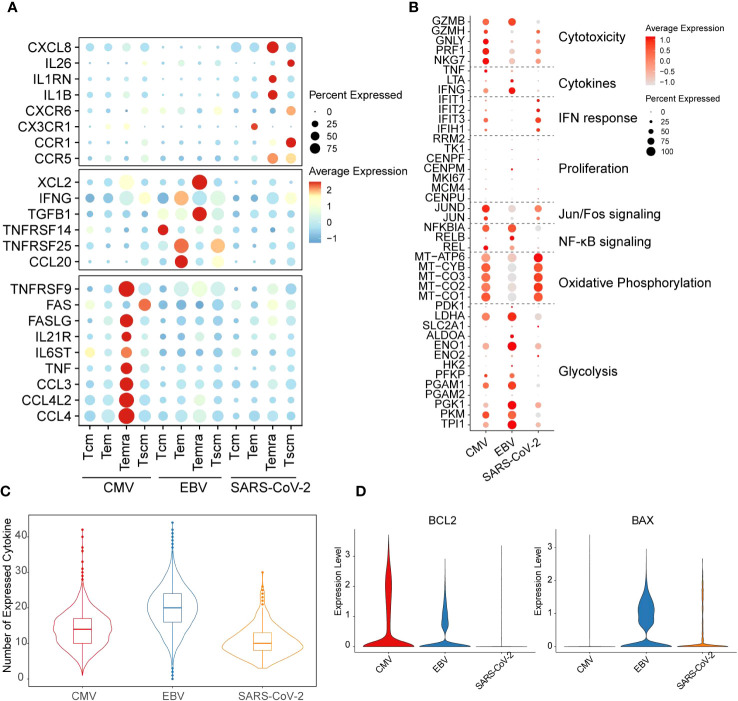
Figure 2.
Distinct functions of different viral-specific T cells. (A) The cytokines with differential gene expression among different cell clusters. For each dot, the size represents the percentage of cells with non-zero expression of given genes (row) in given cell clusters (column). The color is the average expression as denoted in the legend. The virus-specific cytokines are listed on the left. (B) The expression for the marker genes of different functions is shown in the dot plot. The meaning for size and color is the same as that in figure (A). (C) The number of cytokines with non-zero expression in each cell is plotted with the violin plot for each virus-specific T-cell repertoire. The quantile of the numbers is labeled with the boxplot. (D) The expression of gene BCL2 and BAX in each cell is plotted with the violin plot. The red violin indicates CMV-primed T cells, the blue one for EBV-primed cells, and the orange one for SARS-CoV-2-primed ones.

