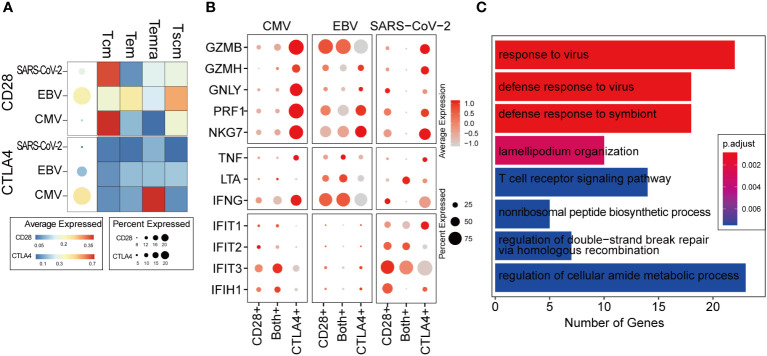
Figure 4.
The ratio of CD28 to CTLA4 related with T-cell activity. (A) The average expression of CD28 and CTLA4 for all cells in given the virus-specific T-cell repertoire is shown in the dot plot. The size is the percentage of cells with non-zero value, and the color is the expression value as denoted in the legend color bars. The heatmap separates the T-cell repertoire into different cell types and with the color represents the average expression in given cell types for each virus. The value is row scaled. (B) Each dot indicates the average expression of a given gene (row) in a given cell cluster (column). The meaning of the dot size is similar with that in (A). (C) The genes positively correlated with the CD28/CTLA-4 ratio was collected for functional enrichment analysis. The top most significantly enriched functions are listed in the barplot. The length of the bar represents the number of genes belonging to given functions. The color is an adjusted p-value.

