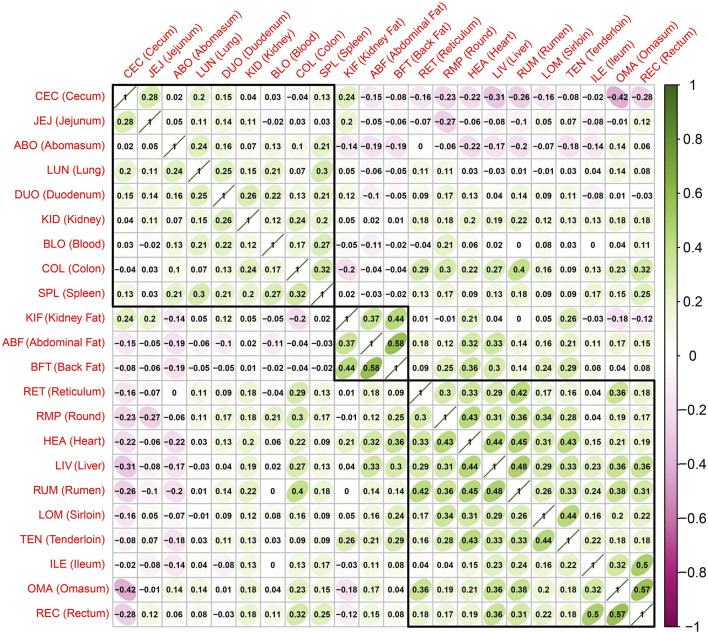
FIGURE 2.
Correlations and hierarchical clustering between tissues based on the t value representing the difference in expression between the case group (sample with a high z-score) and the control group (sample with a low z-score). The closer the correlation value is to 1, the higher the correlation.

