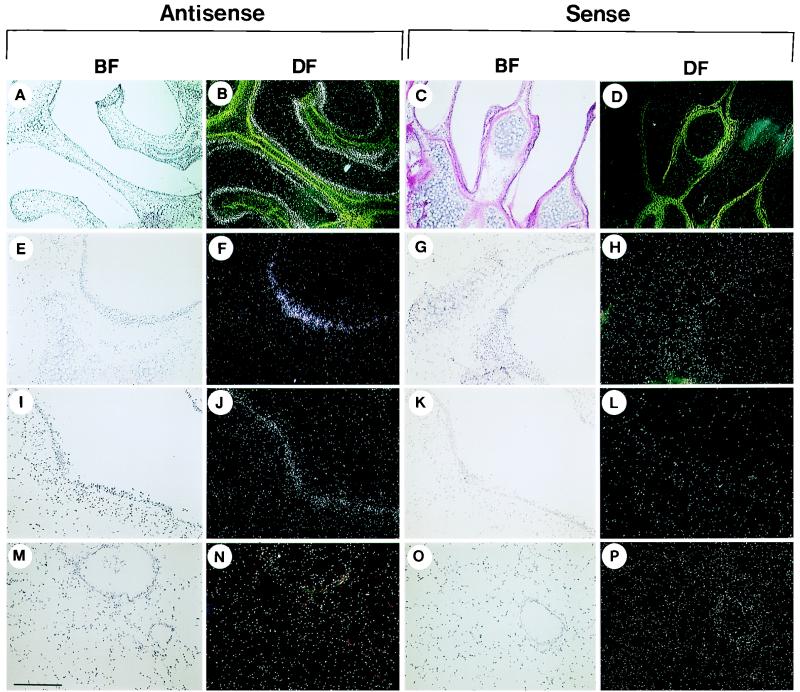
FIG. 6.
Detection of transcripts encoding mBD-1 in the mouse respiratory tract. Antisense and sense probes were used to detect the tissue distribution of mBD-1 expression. Representative sections in dark and bright fields (DF and BF, respectively) from the nose (A to D), trachea (E to H), large bronchioles (I to L), and terminal bronchioles and lung parenchyma (M to P) are shown. Bars: A to D, 0.7 mm; E to P, 270 μm.

