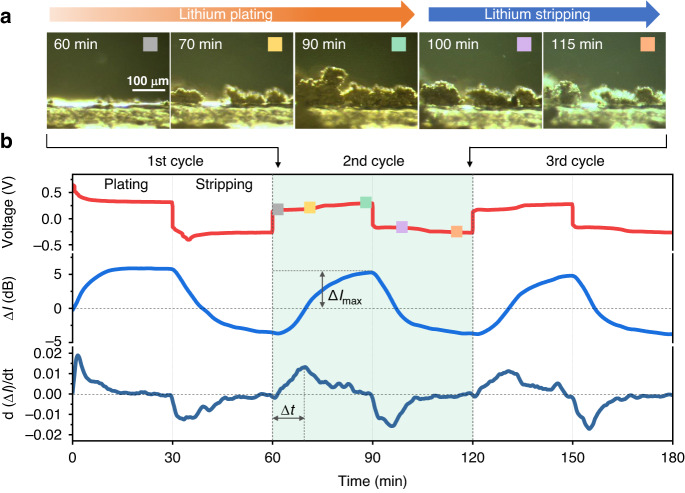
Fig. 4. Tracking of species concentration at electrode interface and analysis of the kinetic process.
a Dark field optical microscope images of lithium dendrites during 2nd cycling, clearly revealing the lithium plating and striping on the surface of the bare lithium anode. b Periodic voltage variation with time (top), the corresponding periodic variation of interface mode amplitude of the implanted TFBG (middle), and its differential optical power evolution (bottom) in charge–discharge cycling tests of the lithium battery. It defines the maximum optical power change (∆Imax), and the response time (∆t) achieved to the peak of the differential of optical power in the lithium plating process

