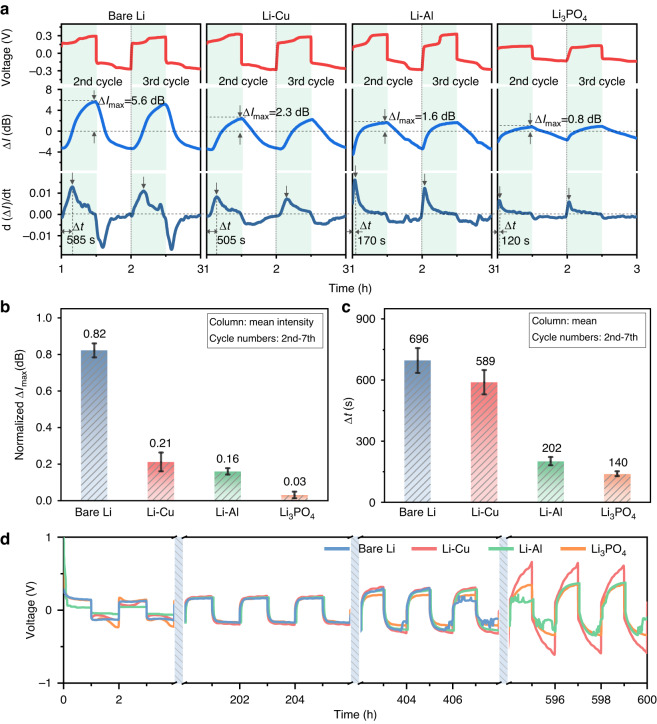
Fig. 5. Analysis of the regulation of lithium plating by the SEI layer.
a Temporal voltage (top), the interface mode amplitude variation of TFBG (middle), and the evolution of differential optical power d(∆I)/dt (bottom) during the stable cycling of lithium batteries with modified SEI layers. Similar to Fig. 4, ∆Imax in Fig. 5 reveals the maximum variation in species concentration at the lithium anode interface during the lithium plating stage. In the bottom panel, ∆t reflects the response time achieved to the peak of the differential of optical power during lithium plating. b, c Quantitative comparison of mass transport at different modified interfaces during lithium plating. d Cycling comparison for Li/Li, Li–Cu/Li–Cu, Li–Al/Li–Al, and Li–Li3PO4/Li–Li3PO4 symmetric cells at a current density of 0.5 mA cm−2

