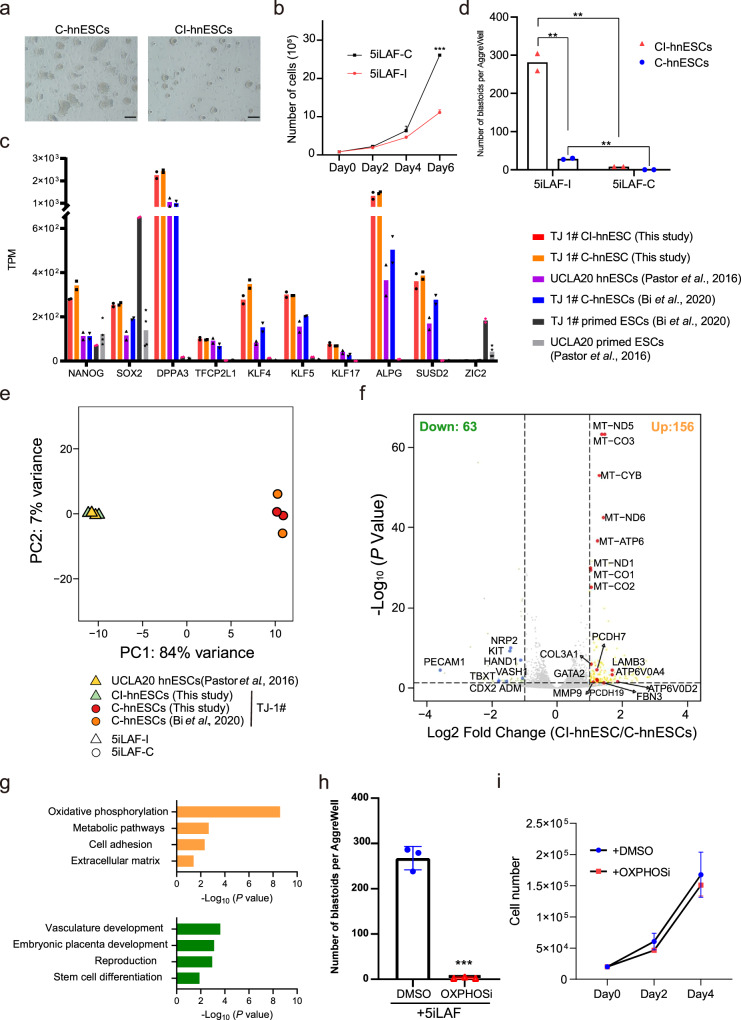
Fig. 2. OXPHOS underlies the capacity of hnESCs to spontaneously generate blastoids.
a Representative phase-contrast images of C-hnESCs (left, cultured in 5iLAF-C, day 6) and CI-hnESCs (right, cultured in 5iLAF-I, day 6). Scale bars, 200 μm. b Proliferation of C-hnESCs cultured in 5iLAF-C (black) or 5iLAF-I (red). n = 3 replicates; mean + s.d.; unpaired two-tailed t-test. ***p = 0.00000416. c TPM (Transcripts Per Kilobase Million) expression level of representative naïve markers and primed marker ZIC2 among cell lines. n = 2 biological replicates (n = 4 for UCLA20 primed ESCs). d Number of blastoids generated from CI-hnESCs and C-hnESCs with 5iLAF-I or 5iLAF-C medium in AggreWell. n = 2 technical replicates; mean; unpaired two-tailed t-test; **P < 0.01. e Principal component analysis (PCA) of bulk RNA-seq datasets from CI-hnESCs, C-hnESCs and published studies. f Volcano plots of differential expressed genes identified using two-sided Wilcoxon Rank Sum Test with Bonferroni correction (|Log2 Fold Change | >1 and FDR < 0.05, upregulated genes in yellow and red, downregulated genes in green and blue) in CI-hnESCs comparing to C-hnESCs. g Bar plot showing the −log10 (P value) of the gene ontology terms enriched in upregulated genes (top) or downregulated genes (bottom). The input genes were selected as was descripted in f and the P values shown were computed with modified one-sided Fisher’s Exact test using David functional annotation tool. h Quantification of blastoids number in 5iLAF-I with dimethyl sulfoxide (DMSO) or OXPHOS inhibitor (IACS-010759, 5 μM). n = 3 technical replicates; mean ± s.d.; unpaired two-tailed t-test; ***p = 0.0000607. i CI-hnESC proliferation in 5iLAF-I with DMSO or OXPHOS inhibitor. n = 3 replicates; mean ± s.d.; Source data are provided as a Source Data file.

