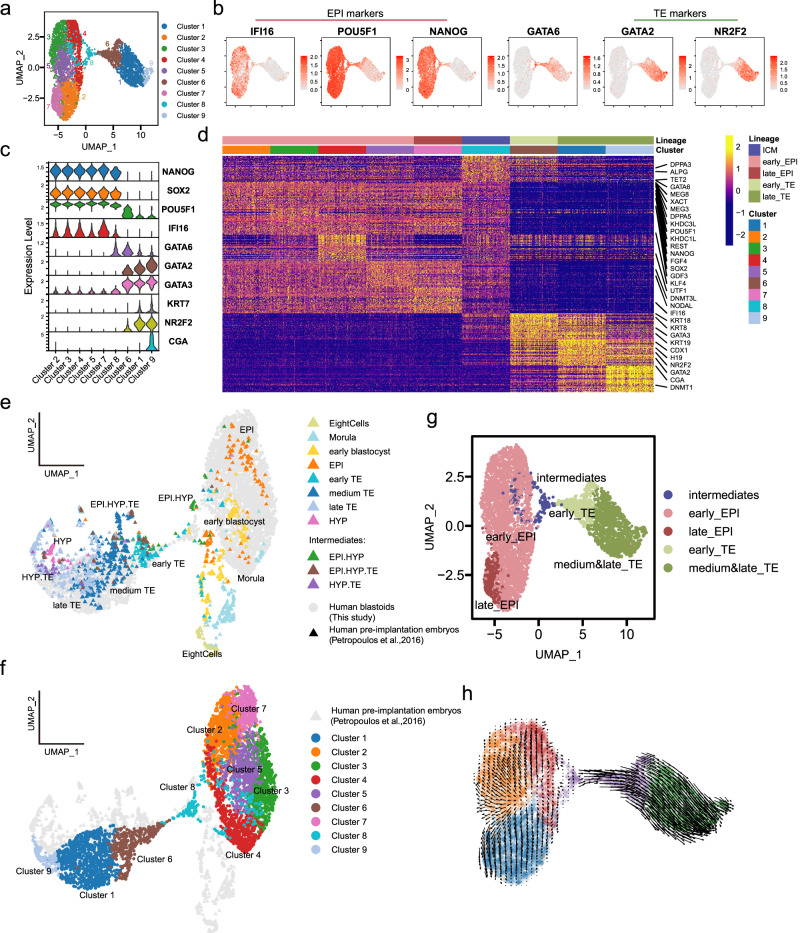
Fig. 3. Spontaneous blastoids resemble early human blastocysts.
a Uniform manifold approximation and projection (UMAP) embedding of single-cell transcriptomes from day6-blastoids generated in AggreWell. b Expression of human EPI markers IFI16, POU5F1 and NANOG and TE markers GATA2 and NR2F2. c Expression level of blastocyst lineage markers in each cluster. d Heat map showing the expression levels of the top 50 genes that are enriched in each cluster. Expression levels: z-scores. e, f UMAP of single-cell transcriptomes of cells from day6-blastoids (f) integrated with published datasets from human early embryos (e). g Rename the clusters (defined in a on the basis of similarities to human blastocyst lineages). h RNA velocity analysis indicating the cell trajectories shown in arrows.

