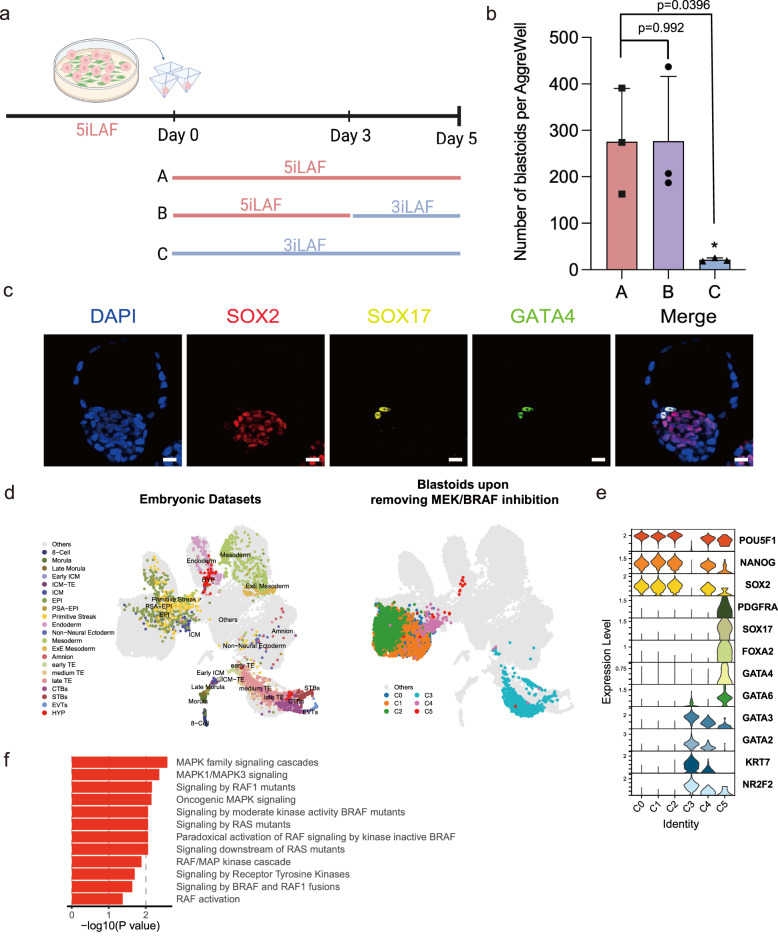
Fig. 4. Spontaneous blastoids specify hypoblast fate upon removal of BRAF/MEK signaling inhibition.
a Schematic of HYP-like cell fate induction by removing BRAF/MEK inhibitors. Created with BioRender.com. Strategies were indicated as follows: A, Spontaneous blastoids were formed by culturing in 5iLAF for 5 days; B, Spontaneous blastoids were formed by culturing in 5iLAF for 3 days first and then switched to 3iLAF (5iLAF-BRAFi-MEKi) for 2 days; C, Spontaneous blastoids were formed by culturing in 3iLAF for 5 days. b Spontaneous blastoid generation efficiency for the indicated conditions in a. n = 3 biological replicates; mean ± s.d.; Ordinary one-way ANOVA with Tukey’s multiple comparisons test; * means p < 0.05. c Representative immunofluorescence staining images of spontaneous blastoids containing HYP-like cells. Scale bars, 20 μm. d Comparison of embryonic datasets (left) with the spontaneous blastoids (right) after removing BRAF/MEK inhibitors from day 3 evidenced the HYP fate specification. PSA-EPI, primitive streak anlage stage epiblast. ExE extraembryonic, CTB cytotrophoblasts, STB syncytiotrophoblasts, EVT extravillous cytotrophoblasts. e Expression levels of blastocyst lineage markers for each cluster. f Enriched gene ontology (GO) terms in the differentially expressed genes of C5 compared against C0-3 identified using two-sided Wilcoxon Rank Sum Test with Bonferroni correction (Log2 Fold Change >0 and FDR < 0.05). The P values shown were computed with modified one-sided Fisher’s Exact test using David functional annotation tool. Source data are provided as a Source Data file.

