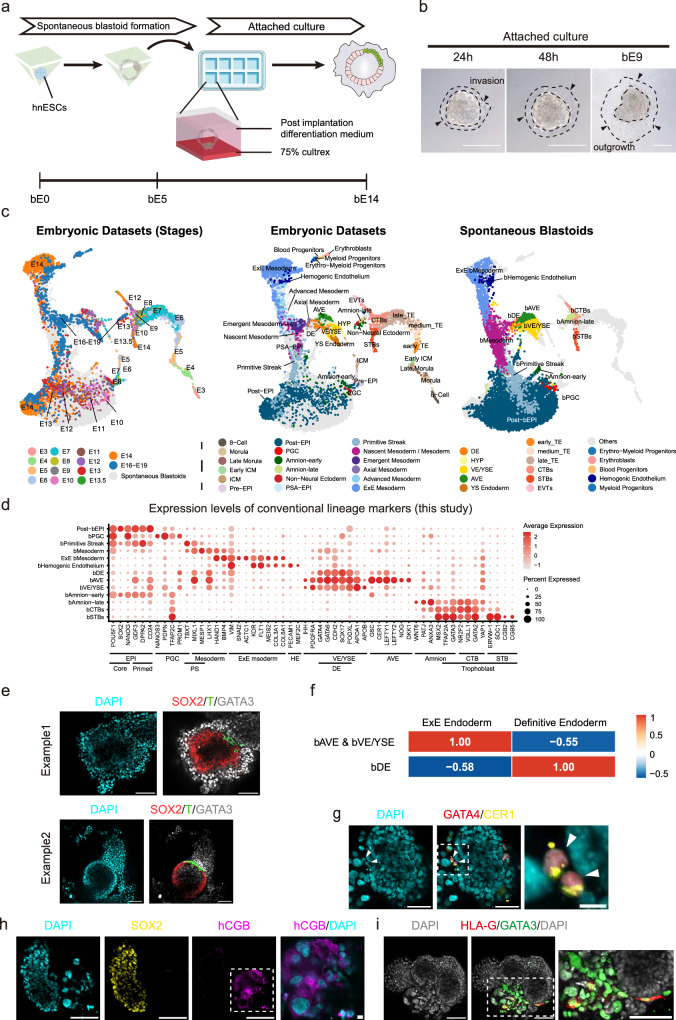
Fig. 5. Spontaneous blastoids have post-implantation developmental potential.
a Schematic of attached culture of spontaneous blastoids for post-implantation development. Created in Adobe Illustrator. b Representative images showing rapid invasion and outgrowth of blastoid trophoblasts. (n > 10). c Comparison of embryonic datasets (left and middle) with the differentiated spontaneous blastoids on bE14 (right). d Gene expression patterns of conventional lineage markers in clusters shown in Fig. 5a. Dot size represents the percentage of cells that express the indicated gene and color intensity represents the expression levels. e Representative immunofluorescent images showing two examples of T+ primitive streak like structures in bE14 blastoids. f Gene set variance analysis (GSVA) comparing similarities of clusters bAVE, bVE/YSE and bDE to natural embryo ExE endoderm and definitive endoderm. Higher values represent closer similarity. g Representative immunofluorescent images of bAVE-like cells showing GATA4 expression in the nucleus and secreted CER1 proteins in the extracellular region. (n = 2 from 2 individual experiments). h Representative immunofluorescent images of bSTBs showing hCGB expression. (n = 2 from 2 individual experiments) i, Representative immunofluorescent images of EVT precurosrs showing co-expression of HLA-G and GATA3 (n = 2 from 2 individual experiments). All scale bars, 100 μm.

