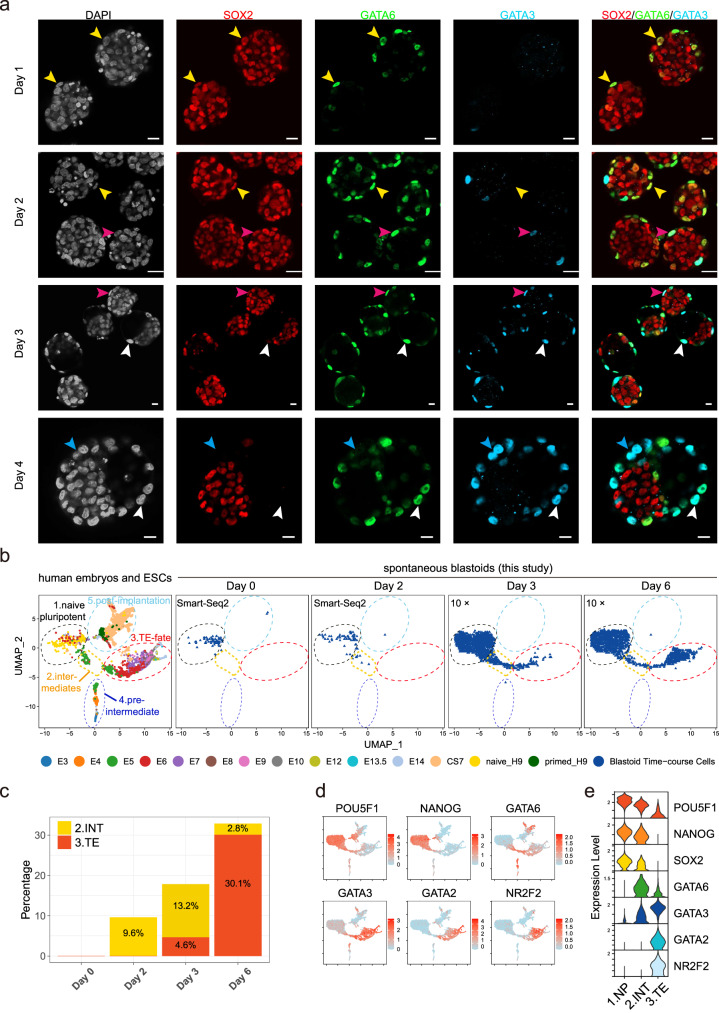
Fig. 7. Dynamics of cell fate specification during spontaneous blastoids formation.
a Representative time-course immunofluorescence staining images of day 1–4 aggregates/blastoids in AggreWell. Yellow arrows: SOX2+GATA6+GATA3− cells; White arrows: SOX2−GATA6+GATA3+ cells; Pink arrows: SOX2+GATA6+GATA3+ cells; Blue arrows: SOX2−GATA6−GATA3+ cells; Scale bars, 20 μm. (n > 10). b Joint UMAP analysis and re-cluster of published human embyros/ESCs data (left) and day 0, 2, 3 and 6 spontaneous blastoid scRNA-seq data (right). c Contribution of cluster 2 and 3 to day 0, 2, 3 and 6 blastoid cells. d, e Expression levels of marker genes in cells and clusters. Source data are provided as a Source Data file.

