Figure 7.
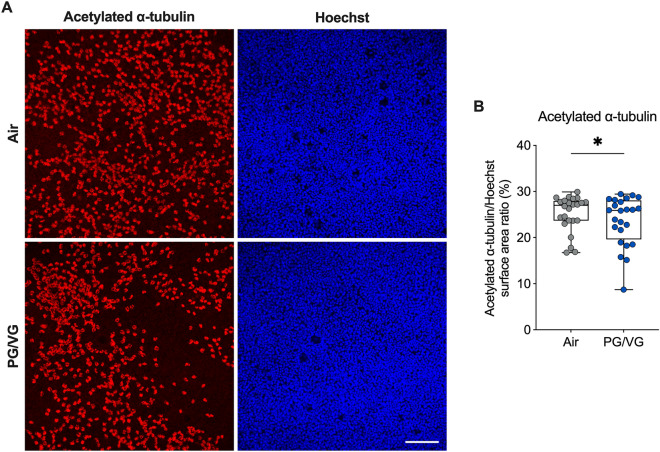
PG/VG aerosols reduce ciliation. (A) Representative confocal image stacks of acetylated α-tubulin (red) and Hoechst stain (blue) in HBEC exposed to air or PG/VG e-cig aerosols for seven days. Scale bar, 100 µm. (B) Quantification of acetylated α-tubulin expression expressed as surface area labeling of acetylated α-tubulin/Hoechst. n = 8 ALI cultures from 8 donors, which were sampled 3 times each, resulting in 24 datapoints in the permutation analysis and shown in the figure. Statistics: Data shown as median (line), 25th to 75th percentiles (box), and minimum to maximum values (whiskers). *p < 0.05, LMM permutation test.

