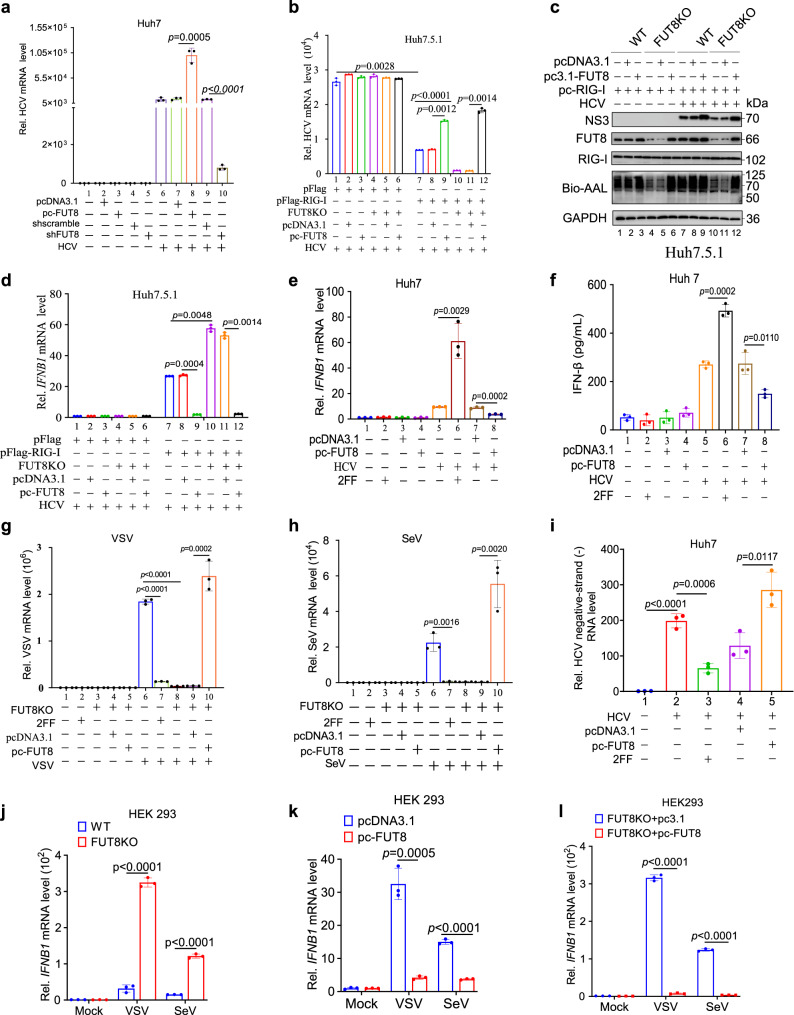
Fig. 5. FUT8 promotes RNA viral replication and suppresses RIG-I-induced type I IFN production.
a RT-qPCR analysis of HCV mRNA expression in Huh7 cells transiently transfected with indicated plasmids for 48 h, and then infected with HCV (MOI = 0.01) for 48 h (n = 3 per group per study). RT-qPCR analysis of HCV mRNA expression (b) and immunoblot analysis of HCV NS3 (c) in WT or FUT8KO Huh7.5.1 cells transiently co-transfected with indicated plasmids for 48 h, and then infected HCV (MOI = 0.01) for 48 h (b, n = 3 per group per study) or 72 h (c). RT-qPCR analysis of IFNB1 mRNA expression in Huh7.5.1 cells (d) or Huh7 cells (e) or ELISA of IFN-β in supernatants of Huh7 cells (f) transiently transfected with indicated plasmids or treated with 2FF for 48 h, and then infected with HCV (MOI = 0.01) for 12 h or 48 h (d–f, n = 3 per group per study). RT-qPCR analysis of virus mRNA expression in FUT8KO HEK293 cells transiently transfected with indicated plasmids or WT HEK293 cells treated with 2FF for 48 h, and then infected with VSV (g) (MOI = 0.001) or SeV (h) (MOI = 0.01) for 48 h (g, h, n = 3 per group per study). i Strand-specific Tth-based RT-qPCR analysis of HCV-negative strand RNA in Huh7 cells transiently transfected with pcDNA3.1-FUT8 or treated with 100 µM 2FF for 48 h, and then infected with HCV (MOI = 0.01) for 48 h (n = 3 per group per study). RT-qPCR analysis of IFNB1 mRNA expression in WT (k and l) or FUT8KO (j and l) HEK293 transiently transfected with indicated plasmids or not for 48 h, and then infected with VSV (MOI = 0.001) or SeV (MOI = 0.01) for 12 h (j–l, n = 3 per group per study). Data are normalized based on GAPDH for a, b, and d–l. Data in all quantitative panels are presented as mean ± SD. Data are representative of three independent experiments. Two-tailed unpaired Student’s t test was used to assess the statistical difference in a, b, d–l. Source data are provided as a Source Data file.

