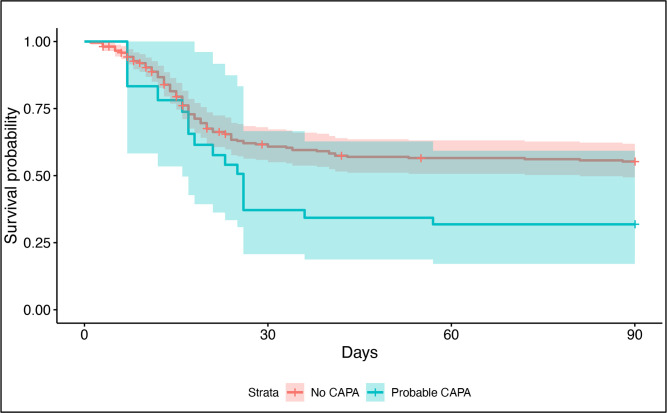
Figure 2.
Simon-Makuch plot displaying time-adjusted survival probability over time in patients with a diagnosis of probable CAPA versus those without. Probability curves and p value calculated using an unadjusted time-dependent Cox proportional hazards model. CAPA, COVID-19-associated pulmonary aspergillosis.

