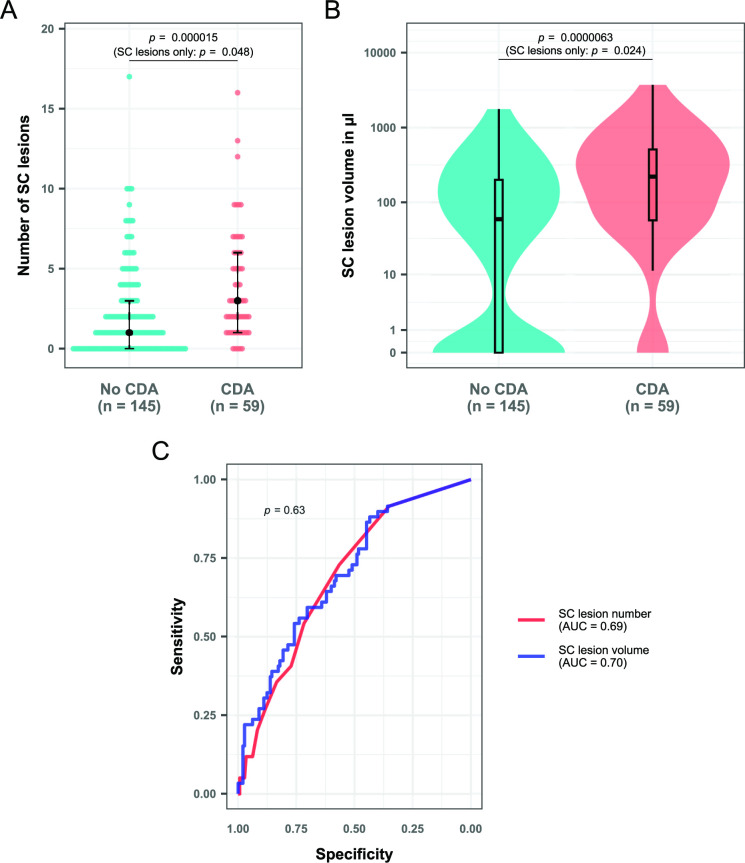
Figure 3.
SC lesion measures in patients with and without CDA on follow-up. (A) Dot plot showing the number of spinal lesions in both groups. The black dots represent the median for the respective group, while the black lines give the IQR. (B) Box/violin plot showing lesion volume in both groups. The y-axis has been log-scaled for better visualisation. P values in parentheses are calculated for the subgroup of patients with at least one spinal lesion. Wilcoxon-Mann Whitney tests were performed in all cases. (C) Receiver operating characteristic curves for both SC lesion measures with CDA as outcome parameter. Between-curve comparison was performed according to the method described by DeLong et al 37 for paired data. AUC, area under the curve; CDA, confirmed disability accumulation; SC, spinal cord.

